
Best Indian Stocks Forecast Evaluation Report by I Know First – November 2019
Summary:
In this live forecast evaluation report, we will examine the performance of the best Indian stocks forecasts generated by the I Know First AI Algorithm for the Indian stock market and sent to our customers on a daily basis. Our analysis covers time period from January 1, 2019 to October 31, 2019.We will start with an introduction to our stock picking and benchmarking methods and then apply it to the stock universe of the S&P BSE. This evaluation is part of our continuous studies of live I Know First’s AI predictive algorithm performance.
Indian Stocks Forecasts Highlights:
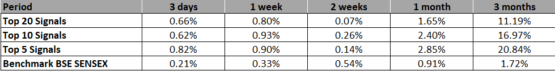
- For long time horizons, Top 5 signals provided the most predictable stocks with a return of 20.84% in a 3-month investment horizon, beating the benchmark S&P BSE by 19.12%.
- There is a clear correlation between increasing time horizons and investment return.
- For the 3 days, 1 week, 1 month and 3 months forecasts, The benchmark was over-performed in all top signal classes.
The above results were obtained based on forecasts’ evaluation over the specific time period using consecutive filtering approach by signal, to give a general overview of the forecasting capabilities of the algorithm for specific stock universe. The following sections of this study will develop the analysis and the data behind the above results and provide you with deeper understanding of the Methodology and the filtering results for different subsets of assets.


About the I Know First Algorithm


The I Know First self-learning algorithm analyzes, models, and predicts the stock market. The algorithm is based on Artificial Intelligence (AI) and Machine Learning (ML), and incorporates elements of Artificial Neural Networks and Genetic Algorithms.
The system outputs the predicted trend as a number, positive or negative, along with a wave chart that predicts how the waves will overlap the trend. This helps the trader to decide which direction to trade, at what point to enter the trade, and when to exit. Since the model is 100% empirical, the results are based only on factual data, thereby avoiding any biases or emotions that may accompany human derived assumptions. The human factor is only involved in building the mathematical framework and providing the initial set of inputs and outputs to the system. The algorithm produces a forecast with a signal and a predictability indicator. The signal is the number in the middle of the box. The predictability is the number at the bottom of the box. At the top, a specific asset is identified. This format is consistent across all predictions.
Our algorithm provides two independent indicators for each asset – Signal and Predictability.

The Signal is the predicted strength and direction of movement of the asset. Measured from -inf to +inf.
The predictability indicates our confidence in that result. It is a Pearson correlation coefficient between past algorithmic performance and actual market movement. Measured from -1 to 1.
You can find the detailed description of our heatmap here and an example of our daily forecast for Indian stock market here.
The Stock Picking Method
The method in this evaluation is as follows:
We take the top X most predictable assets, and from them we pick the top Y highest signals.
By doing so we focus on the most predictable assets on the one hand, while capturing the ones with the highest signal on the other.
For example, a top 30 predictability filter with a top 10 signal filter means that on each day we take only the 30 most predictable assets, and then we pick from them the top 10 assets with the highest absolute signals.
We use absolute signals since these strategies are long and short ones. If the signal is positive, then we buy and, if negative, we short.
Indian Stocks Forecast Performance Evaluation Method
We perform evaluations on the individual forecast level. It means that we calculate what would be the return of each forecast we have issued for each horizon in the testing period. Then, we take the average of those results by strategy and forecast horizon.
For example, to evaluate the performance of our 1-month forecasts, we calculate the return of each trade by using this formula:

This simulates a client purchasing the asset based on our prediction and selling it exactly 1 month in the future.
We iterate this calculation for all trading days in the analyzed period and average the results.
Note that this evaluation does not take a set portfolio and follow it. This is a different evaluation method at the individual forecast level.
The Benchmarking Method
in order to evaluate our algorithm’s performance in comparison to the Indian market, we used the S&P BSE (^BSESN) as a benchmark.
The S&P Bombay Stock Exchange Sensitive Index (BSE SENSEX) is a free-float-market-weighted index of 30 well-established companies listed on the Bombay Stock Exchange.
The index component companies are some of the largest companies traded in the Indian market and represent various industrial sectors in the Indian economy. therefore, the S&P BSE is a strong indicator of the performance of India’s domestic stock market, which makes it a good benchmark for our algorithm’s performance analysis.
Stock Universe Under Consideration – Indian Stocks
In this report we conduct testing for Indian stock market that I Know First cover by its algorithmic forecast in “Indian stocks” package. The period for evaluation and testing is from January 1, 2019 to October 31, 2019. During this period, we were providing our clients with daily forecasts for Indian stocks and the time horizons which we evaluate in this report are 5 periods spanning from 3 days to 3 months. This evaluation is part of our series of live evaluation studies of I Know First’s AI predictive algorithm performance. The previous study conducted for the period from January 3, 2018 to September 28, 2018 is available here. Also, for the comparison purposes we consider the performance of S&P BSE, which is a commonly used for representation of India’s stock market performance, over the same time period and corresponding time horizons. The methodology of S&P BSE can be found here.


Conclusion
In this analysis, we demonstrated the out-performance of our forecasts for the stocks from Indian market picked by I Know First’s AI Algorithm for the period from January 1, 2019 to October 31, 2019. Based on the presented observations we record significant out-performance of the Top 30 stocks filtered by predictability for the 1 day, 3 days, 1 week, 1 month and 3 months. on the 2 weeks horizon, our algorithm generated a positive return but didn’t outperform the S&P BSE benchmark.
In the short time horizons, filtering by signals didn’t improve the performance of the algorithm, and in some cases the signal filtering resulted in lower returns, but when looking at longer time periods (1 month and 3 months), it’s clear that filtering stocks by signal improves both hit ratios and even more significantly, the returns. Therefore, an investor who wants to critically improve the structure of his investments by adding long term positions on Indian stocks to his portfolio can do so by simultaneously utilizing the I Know First predictability and signal indicators as criteria for picking stocks.


