
ETF Sectors Forecast Based on AI: Returns up to 9.81% in 1 Month
ETF Sectors Forecast
This ETF Sectors Forecast forecast is part of the ETF Sectors Package, as one of I Know First’s quantitative investment solutions. Sector Investing An investor or portfolio that invests assets into one or more sector of the economy. The Global Industry Classification Standard (GICS) consists of 11 sectors: Communication Services, Consumer Discretionary, Consumer Staples, Energy, Financials, Health Care, Industrials, Information Technology, Materials, Real Estate, and Utilities. We determine the top ETFs by screening our database daily using our advanced algorithm. The full ETFs Package includes a daily forecast for a total of 20 ETFs with bullish and bearish signals:
- Top 10 ETFs for the long position
- Top 10 ETFs for the short position
Package Name: ETF Sectors Forecast
Recommended Positions: Long
Forecast Length: 1 Month (11/24/23 – 12/25/23)
I Know First Average: 4.62%
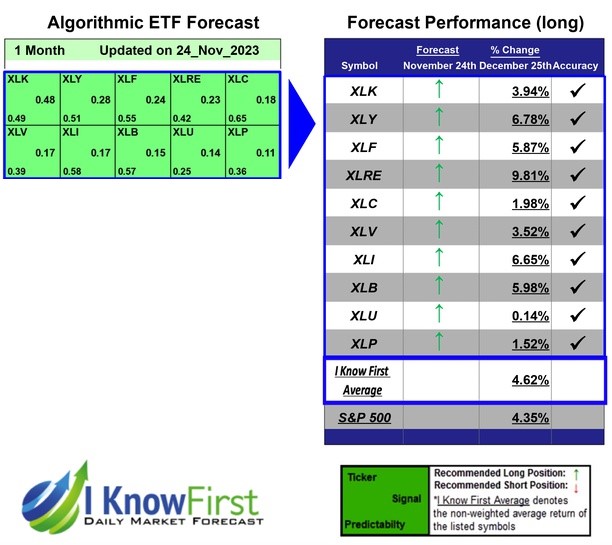

I Know First’s State of the Art Algorithm accurately forecasted 10 out of 10 trades in this ETF Sectors Forecast Package for the 1 Month time period. The greatest return came from XLRE at 9.81%. XLY and XLI had notable returns of 6.78% and 6.65%. The overall average return in this ETF Sectors Forecast package was 4.62%, providing investors with a 0.27% premium over the S&P 500’s return of 4.35% during the same period.
Algorithmic traders utilize these daily forecasts by the I Know First market prediction system as a tool to enhance portfolio performance, verify their own analysis and act on market opportunities faster. This forecast was sent to current I Know First subscribers.
How to interpret this diagram
Algorithmic Stock Forecast: The table on the left is a stock forecast produced by I Know First’s algorithm. Each day, subscribers receive forecasts for six different time horizons. Note that the top 10 stocks in the 1-month forecast may be different than those in the 1-year forecast. In the included table, only the relevant stocks have been included. The boxes are arranged according to their respective signal and predictability values (see below for detailed definitions). A green box represents a positive forecast, suggesting a long position, while a red represents a negative forecast, suggesting a short position.
Please note-for trading decisions use the most recent forecast. Get today’s forecast and Top stock picks.


