Stock Filtering by the I Know First Signal and Predictability Indicators
In the following we expand on research performed in previous articles by further exploring the effect and interpretation of the I Know First prediction measures and how these can be used for stock filtering. The analysis shows that as predictability and signal strength increase the average trade returns based on these indicators grow in a consistent, significant, and robust manner and that by daily selecting stocks with the highest predictabilities and signals average returns significantly above those of the S&P500 Index can be achieved.
Signal and Predictability
As described here the I Know First signals and predictabilities are generated on a daily basis for each stock and represent respectively the algorithm’s prediction regarding the direction and size of the return and the confidence in this prediction for various time horizons. These indicators are computed by the I Know First algorithm in response to the patterns and relationships learned from the historical data and matched to the current market environment. A variety of rules based on these indicators can be developed for trade execution and rebalancing on a daily basis for which a high predictability level and signal strength are key factors.
Mean Return per Trade
In the following we explore a very simple analysis of these predictions: for each trading day from January to June 2016 we filter stocks from the S&P500 universe by their short-term I Know First predictabilities and signals and compute their average close-to-close returns per trade. We use close-to-close returns since these are the changes the algorithm is actually predicting and refer to previously published articles that show how these predictions can be systematically utilized for open-to-close trading strategies. In this analysis the predictabilities are filtered by fixed levels and the signals by daily quantiles; the results are plotted below.

The graph clearly shows that the mean returns per trade consistently increase along both I Know First prediction measures, peaking for the highest predictabilities and signals. Thus the two indicators are informative at all levels and, on average, higher indicators imply higher returns. The highest average return per trade achieved in this analysis (corresponding to the highest predictabilities and signals) equals 0.27% for the considered time frame versus a daily close-to-close mean return per trade of 0.08% for the S&P500 constituents in the same time period.
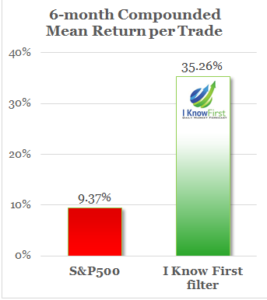
To understand how these numbers translate to total returns we compound the mean return per trade for the 6-month period analyzed (see a more detailed explanation of how the compounded return is computed in the figure caption below). This shows that these mean returns per trade correspond to a total return of 35.26% for the stocks filtered by the I Know First Indicators against 9.37% for the S&P500 Index. Thus by each day selecting the stocks with the highest predictabilities and signals (as done in some of the I Know First trading strategies) significantly higher returns than those of the S&P500 Index can be achieved.

The 6-month compounded mean return per trade for the S&P500 stocks versus the stocks filtered by the I Know First signal and predictability indicators. Here we compound by assuming daily average returns equal to mean returns per trade. The compounded return is then computed as follows: $latex \text{compounded return} = (1+\text{mean return per trade})^{\text{trade days}}&bg=E6E6E6$. It estimates the total return achieved by a daily return of “mean return per trade” for a number of days equal to “trade days”.
Risk Adjusted Mean Return
In order to adjust the average return to the risk related to the stock selection process we look further into the distribution of the returns. We do this by exploring a measure similar to the Sharpe Ratio computed by dividing the mean return per trade by the standard deviation of the returns for the various predictability and signal combinations. This gives us a more robust indicator of the performance of the stock selection as it penalizes the mean return by the width of its distribution and thus by the risk involved in the selected trades (a higher ratio for strategies with equal returns indicates a preferable strategy). Moreover, this ratio can be used to compare return distributions as it relays information about the confidence we have in the computed mean return as an estimate of the true mean return. Larger standard deviations and thus lower confidence in the estimator will pull the ratio towards zero and cast doubt on the estimate.

As shown in the plot above the dynamics in terms of this measure are consistent with those using the mean return per trade. Increasing predictability and signal consistently imply higher ratios confirming the previous results for this risk-adjusted return. The mean return per trade to return standard deviation ratio for the highest signal-predictability combination in this analysis was computed as .078 while the same ratio for the S&P500 constituents gives .045. Thus, even along this metric the trades selected by the I Know First algorithm vastly outperformed the benchmark.
Conclusion
Overall the analysis shows that the mean returns per trade and the mean return per trade to standard deviation ratio consistently grow with the I Know First indicators as the highest returns are achieved by using the highest signal-predictability combination. Moreover, returns significantly above the benchmark can be attained by daily filtering stocks for these highest combinations of the I Know First indicators.
People who read this article also liked:


