S&P 100 Stocks: AI Outperforms S&P 500 by 12.59% with an Accuracy of 99%

Highlights:

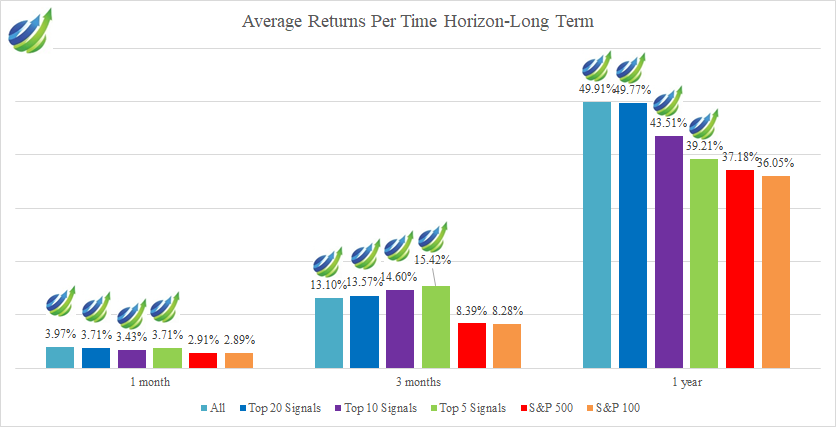
  • The highest average return is 49.91% for the All Signals on a 1-year time horizon
  • Predictions reach up to 99% hit ratio regardless of economic conditions amid COVID-19
  • The S&P 500 benchmark has an overall increasing trend and has gained by 53.41% over the evaluation period from 30th April 2020 to 29th August 2021. The S&P 100 has a return of 54.04% for the same period of time
  • Even during the pandemic, all the stocks forecast have outperformed the S&P 500 and the S&P 100 indexes
  • I Know First provides an investment strategy for institutional investors that has generated a return of 71.43% and has exceeded the S&P 500 return by 18.02% for the analized period

Read Full Report

Retail Stocks Forecast: AI Stock Algorithm Outperforms S&P 500 for Short and Long Positions by 35%

Highlights:

  • The best return was generated by the Top 5 Signal index on the 1 year time period at 140.64%
  • The Hit Ratio was more than 60% for all long term horizons.
  • Even during uncertain pandemic times, I Know First has outperformed the S&P500 for all signals except for the 3 day forecast.
  • On 14-days short term horizon, I Know First's Retail Stocks forecasts have outperformed S&P 500 by 2.25%.

Read Full Report

I Know First Weekly Review Algorithmic Performance: November 16th, 2020

I Know First Weekly Newsletter
Investment Selection Using AI Predictive Algorithm
November 16, 2020

Read The Full Newsletter

I Know First Evaluation Report for Highest Implied Volatility Options

Executive Summary

In this stock market forecast evaluation report, we will examine the performance of the forecasts generated by the I Know First AI Algorithm for Highest Implied Volatility Options for long and short positions which were sent daily to our customers. Our analysis covers the period from May 15th, 2020, to October 7th, 2020. 

Chart 1: Performance comparison for Top 20, Top 10, and Top 5 signals for Implied Volatility Options vs S&P 500 Highlights for short term horizon from May 15th, 2020, until October 7th, 2020.

Chart 2: Performance comparison for Top 20, Top 10, and Top 5 signals for Implied Volatility Options vs S&P 500 Highlights for long-term horizons from May 15th, 2020, until October 7th, 2020.

Top Implied Volatility Options Highlights

  • All the signal groups' returns on the short-term horizon outperformed the S&P 500 Index, especially the ones for the 7 and 14 days time horizons.
  • The Top 10 and Top 5 signal groups outperformed the S&P 500 Index by over 5% and 15%, respectively, for the 3 months time horizon.
  • Higher signals had higher returns for every time horizons except for the 3 days time horizon.

I Know First Evaluation Report For Undervalued Stocks

Executive Summary

In this Know First forecast evaluation report, we will examine the performance of the forecasts generated by the I Know First AI Algorithm for the Low P/E Stocks, a subpackage of the Fundamental package, for short and long positions that were sent daily to our customers. Our Analysis covers the period from May 17, 2020, until September 9, 2020. We will start with an introduction to our asset picking for undervalued stocks and benchmarking methods. In this case, it apply to the universe covered by us in the Low PE subpackage.

undervalued stocks
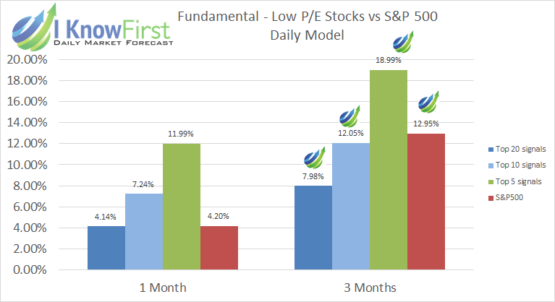
Chart 1: Performance comparison for Top 20, Top 10, and Top 5 signals for Fundamental - Low P/E Stocks vs S&P 500 for shorter-term horizons from May 17, 2020, until September 9, 2020.
Chart 2: Performance comparison for Top 20, Top 10, and Top 5 signals for Fundamental - Low P/E Stocks vs S&P 500 for longer-term horizons from May 17, 2020, until September 9, 2020.

Top Undervalued Stocks Highlights

  • The Top 10 and Top 5 signal groups consistently outperformed the S&P 500 Index.
  • All the group returns had a good performance, especially the ones for the 14 days and 1-month time horizon. Every group on those time horizons registered a significant higher return than the S&P 500 Index.
  • The Top 5 signal group significantly outperformed the S&P 500 for all time horizons.

I Know First Evaluation Report For Interest Rates Assets Universe

Executive Summary

  • Top 5 signals provided the most predictable stocks with a return of 4.85% in a 3-month investment horizon, beating the benchmark by 4.29%.
  • There is a clear positive correlation between increasing time horizons and heightened investment returns.
  • The benchmark was over-performed in the top 20, 10 and 5 signal classes for every time horizon - from 3 days all the way up to 3 months.

Read The Evaluation Report

I Know First Live Forecast Evaluation Report For Under 10 Dollars Stocks Package

This performance evaluation for the Under 10 Dollars stocks package was written by Diana Na Kyoung Lee, an Applied Math-Computer Science student at Brown University.

Executive Summary

In this forecast evaluation report, we will examine the performance of the forecasts generated by the I Know First AI Algorithm for stocks from the Stocks Under 10 Dollars Package, which is sent to our customers on a daily basis. Our analysis covers the time period from 1 April 2018 to 31 May 2019. We will start with an introduction to our asset picking and benchmarking methods and then apply it to the stock universe of all of the stocks covered by us in the Under 10 Dollars Package. We will then compare returns based on our algorithm with the benchmark performance over the same period.

Pages:12»