Stock Market Algorithm: What-If Analysis Response Modeling
Stock Market Algorithm
Summary
- Machine Learning review – Read more here
- Bayesian Networks
- Black Swan Events
- What-If Analysis
- I Know First’s New What-If Analysis Service
Machine Learning
Most people are familiar with the Butterfly Effect, the concept that each action no matter how small has the potential to set off a chain reaction that can have far-reaching consequences. Artificial intelligence machines that are developed to model and make predictions on complex systems, like the stock market, must consider the possibility of any event occurring that can alter the outcome of the system on the following day, and in the following weeks, months and even years.
Machine learning works by absorbing large amounts of data and finding laws and patterns within the data. Based on discovered patterns, the machine is able to predict what is most likely to happen next. A predictive algorithm that is analyzing the stock market, for example, examines market data spanning many years, identifies the patterns in the stock trends and then will output whether stocks, commodities, indices, etc. will either increase or decrease.
Investors use algorithmic tools, in addition to fundamental analysis, to determine the best market opportunities and to know when is the best time to enter or exit the market. Another possible way of analyzing the market and forecasting future market conditions is called scenario analysis, or what-if analysis. Rather than analyzing the market and producing one output, scenario analysis aims to examine multiple possible outcomes along with the probability of each scenario. This allows investors to determine the risk involved in a particular investment by revealing the variance in end results based on the probability of fluctuating factors.

Bayesian Networks
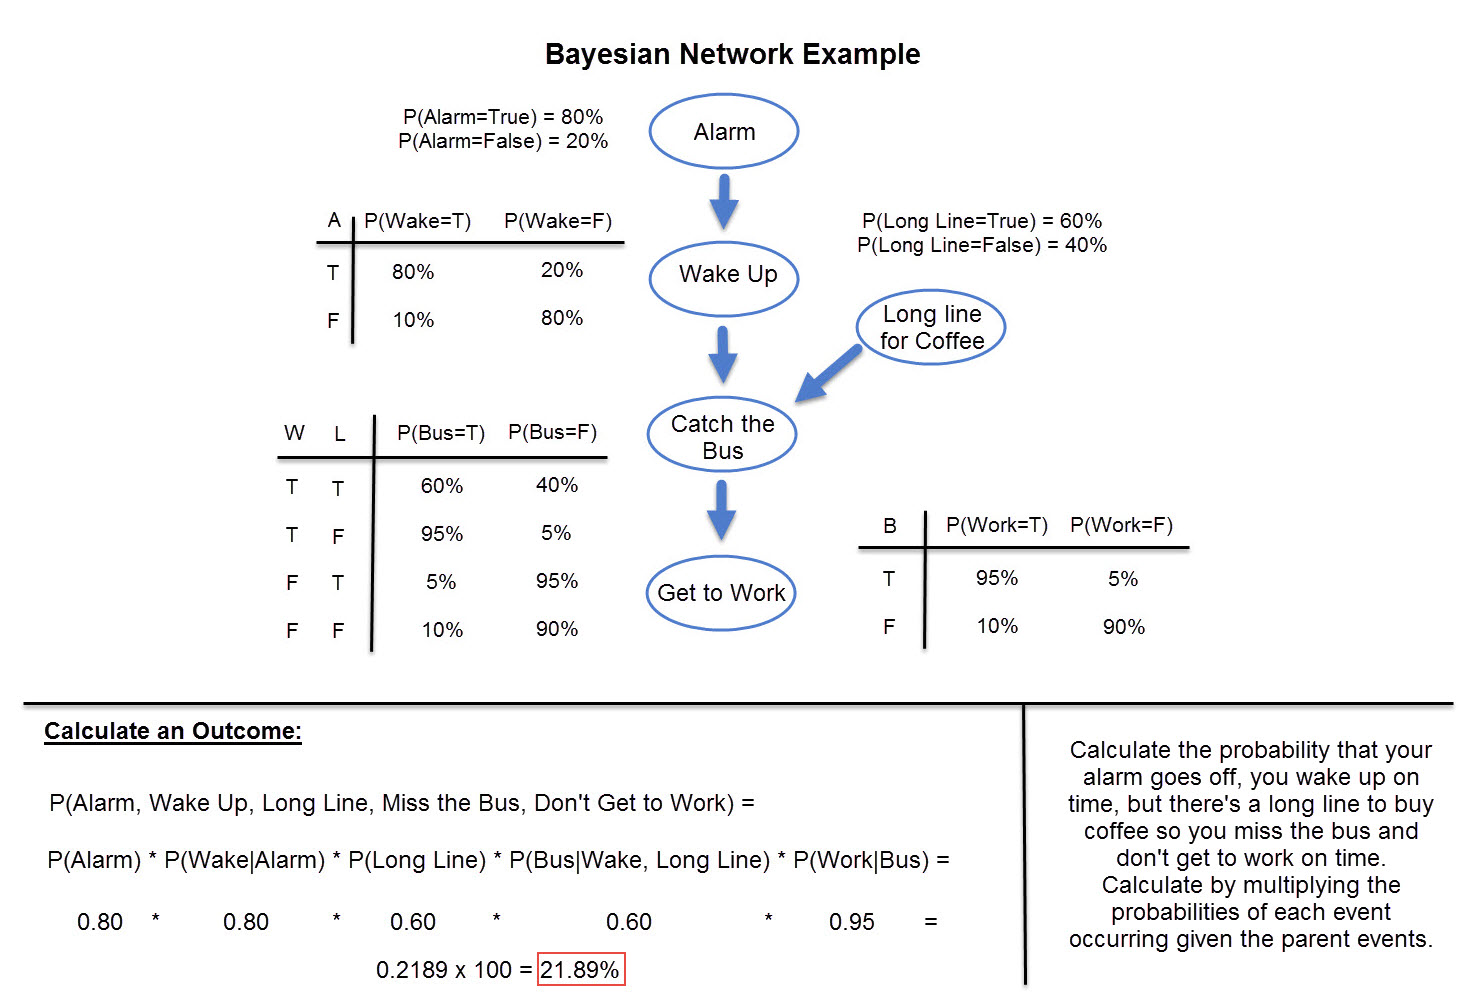
Bayesian Networks are graphical models for rationalizing uncertain variables and their direct connections. Simple Bayesian Networks are nothing more than flow charts, with the nodes representing variables (i.e. potential event or occurrence) and the lines representing the direct connections between each variable. Each line that connects two nodes has an accompanying probabilistic strength associated with it. The combination of these statistical probabilities shows the probability distribution of all possible scenarios.
In the Bayesian Networks, each event has a conditional probability. Conditional probability is the probability that an event will occur assuming that another event has occurred. The value of the probability of event B occurring given event A is found by dividing the probability of events A and B occurring by the probability of just event A occurring.
An example of a simple Bayesian Network with associated probabilities is shown below. Each morning a scenario plays out, one of many possible scenarios. This simple Bayesian Network is a mapping of the probabilities that somebody gets to work in the morning. Depending on how the person wakes up, he can either catch or miss the bus which will help to determine if he gets to work. The probability of each ‘parent’ event affects the probability of all of the future steps, the likelihood of each event happening independent of what happened in the past.
What-If Analysis: Black Swan Events
Black Swan events are events that are unexpected and unpredictable. They refer to events that occur that deviate from what is expected in a particular situation. These events, whether it be a bank crash or a war or a severe storm, affect the stock market and it is possible to analyze their effects on the market after they happen. What investors need, though, is to be able to know how the market will react to these events before they happen.
The market goes through stages with the rules changing at each stage. In a multivariate model, these “stages” are represented by a specific combination of input values. By setting the input values to be representative of the current stage of the market, it is possible to analyze the market in different ways. Varying one of the inputs, for example, will reveal the market’s response to a particular event. The same event (a change in the chosen input) will cause a different (opposite, stronger, weaker, or no) effect depending on the stage. Differing other inter-related (highly correlated or dependent events), and measuring how the model responds, will allow one to construct a conditional probability tree, describing all possibilities and probabilities.
Response modeling, measuring a response of a multivariate model with one input value being changed, is the basis for what-if analysis. Investors want to know what will happen after certain events, like the Feds decision to raise interest rates. With what-if analysis, it’s possible to look at the stock market’s stage in November, before the decision was made, and to analyze the probability of each possible outcome and the effects that the outcome would have on the market.
I Know First’s What-If Analysis
 I Know First’s latest forecasting product is the “What If Scenarios”, a tool to simulate different market conditions. These scenarios are based on our current forecasting algorithms and endeavor to see beyond tomorrow’s actions of major market players. They provide macroeconomic perspectives to monetary policies and market fluctuations.
Market response to any event depends on the circumstances, on current market conditions, and what preceded them. Thus, we will also measure the market sensitivity to such moves, and even assign a probability, for example, of anticipated Fed or ECB actions, and what the market reaction will be, based on these simulations.
This service is meant for institutional investors who desire more detailed scenarios for their investment plan though it can also be adapted to other needs.


