

Aggressive Stocks Forecast: AI vs Stock Market Volatility During Pandemic in 2021
Executive Summary
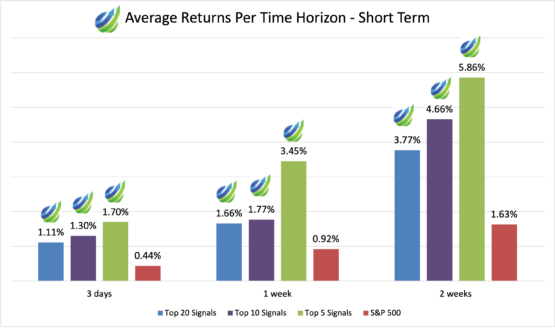
The purpose of this report is to present the results of live forecast performance evaluation for the I Know First AI Algorithm, specifically for the Aggressive stocks forecast. The following results were observed when signal and predictability filters were applied to pick the best-performing stocks out of the most predictable ones. The period under evaluation is from 1st April 2020 to 17th June 2021. The corresponding returns distribution of stock filters for the Aggressive stocks are shown below:


The Aggressive Stocks Forecast Highlights:
- The highest average return is 258.34% for the Top 10 Signals on a 1-year time horizon
- All average returns for a long-term 1-year period are over 194.14%, higher than the S&P benchmark for more than 150.05%
- The S&P benchmark has an overall increasing trend and has gained by 79.9% over the evaluation period from 1st April 2020 to 17th June 2021
- Even during the pandemic, all the aggressive stocks forecast have outperformed the S&P 500 benchmark exceedingly
The above results are based on forecasts’ evaluation over the specific time period using a consecutive filtering approach. Consecutive filtering includes predictability, then signal, to give an overview of the forecasting capabilities of the algorithm for the specific stock universe.
About the I Know First Algorithm
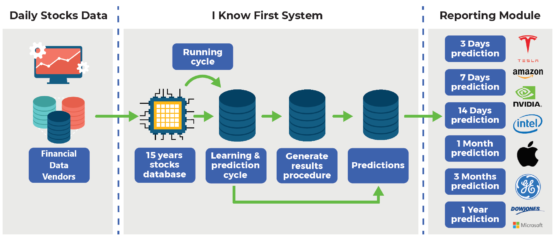

The I Know First self-learning algorithm analyzes, models, and predicts the capital market, including stocks, bonds, currencies, commodities and interest rates markets. The algorithm is based on Artificial Intelligence (AI) and Machine Learning (ML), and incorporates elements of Artificial Neural Networks and Genetic Algorithms.
The system outputs the predicted trend as a number, positive or negative, along with a wave chart that predicts how the waves will overlap the trend. This helps the trader to decide which direction to trade, at what point to enter the trade, and when to exit. Since the model is 100% empirical, the results are based only on factual data, thereby avoiding any biases or emotions that may accompany human derived assumptions. The human factor is only involved in building the mathematical framework and providing the initial set of inputs and outputs to the system. The algorithm produces a forecast with a signal and a predictability indicator. The signal is the number in the middle of the box. The predictability is the number at the bottom of the box. At the top, a specific asset is identified. This format is consistent across all predictions.
Our algorithm provides two independent indicators for each asset – signal and predictability.
The signal is the predicted strength and direction of movement of the asset. This is measured from -inf to +inf.
The predictability indicates our confidence in that result. It is a Pearson correlation coefficient between past algorithmic performance and actual market movement. This is measured from -1 to 1.
You can find a detailed description of our heatmap here.
The Stock Picking Method
The method in this evaluation is as follows:
We take the top X most predictable assets and, from them, we pick the top Y highest signals.
By doing so we focus on the most predictable assets on the one hand. On the other hand, capturing the ones with the highest signal.
For example, a top 30 predictability filter with a top 10 signal filter means that on each day we take only the 30 most predictable assets. Then we pick from them the top 10 assets with the highest absolute signals.
We use absolute signals since these strategies are long and short ones. If the signal is positive, then we buy and, if negative, we short.
The Stock Market Forecast Performance Evaluation Method
We perform evaluations on the individual forecast level. It means that we calculate what would be the return of each forecast we have issued for each horizon in the testing period. Then, we take the average of those results by strategy and forecast horizon.
For example, to evaluate the performance of our 1-month forecasts, we calculate the return of each trade by using this formula:

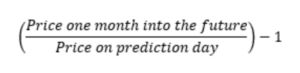
This simulates a client purchasing the asset based on our prediction and selling it exactly 1 month in the future.
We iterate this calculation for all trading days in the analyzed period and average the results.
Note that this evaluation does not take a set portfolio and follow it. This is a different evaluation method at the individual forecast level.
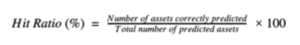
The Hit Ratio Method
The hit ratio helps us to identify the accuracy of our algorithm’s predictions.
Using our Daily Forecast and Global Model asset filtering, we predict the direction of the movement of different assets. Our predictions are then compared against the actual movements of these assets within the same time horizon.
The hit ratio is then calculated as follows:

The Benchmarking Method – S&P 500 Index
In order to evaluate our algorithm’s performance in comparison to the US market, we used the S&P 500 as a benchmark. The S&P 500 measures the stock performance of the largest 500 companies by market cap listed on different stock exchanges in the United States. It is one of the most followed equity indices. It is frequently the best indicator for the overall performance of US public companies and the US market as a whole. S&P 500 is a capitalization-weighted index. The weight of each company in the index is determined based on its market cap divided by the aggregate market cap of all the S&P 500 companies.
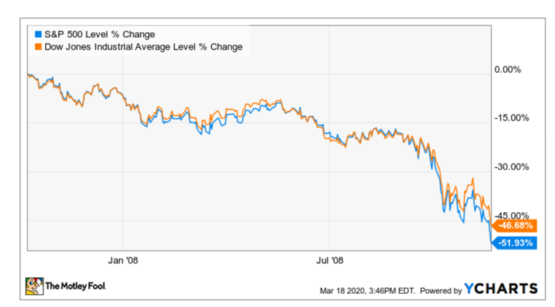
COVID-19’s Impact on S&P 500
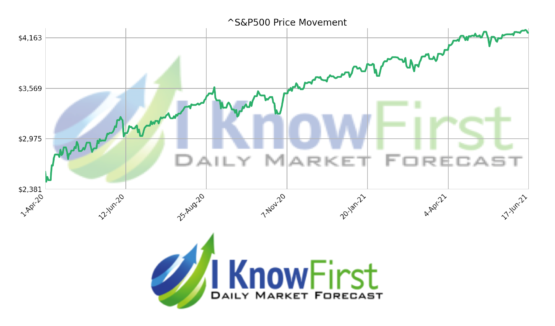
Understanding what is happening in the market with the S&P 500 stock index is important in predicting aggressive stocks. The S&P 500 was up 28.9% for 2019, its biggest one-year gain since 2013 when it rallied 29.6%. However, in March 2020 S&P 500 index dropped 33.68 % in around one month. The COVID-19 had led to one of the fastest U.S. stock market declines in history. Based on fool.com’s example, the S&P 500 stock index in 2020 can be compared with the 2007-2009 global financial crisis.

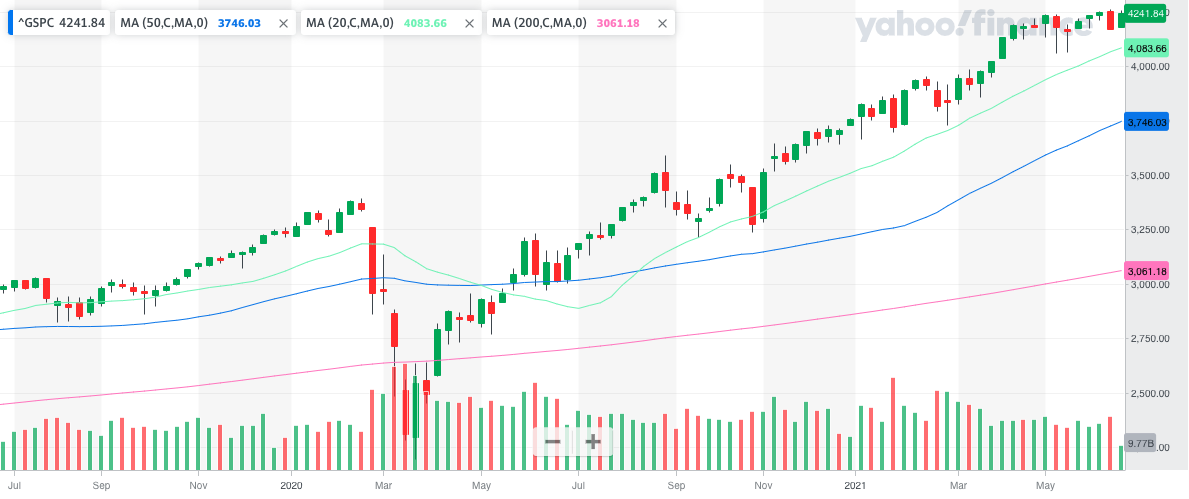
From the below graph, we can observe that the stock market has started to recover after this sudden drop in March 2020, and during our evaluation period, it is generally increasing with a promising trend. It is also encouraging to see the 20-day moving average crossing the 50-day moving average in July 2020, indicating an uptrend signal for S&P 500. Plus, the 200-day moving average line is constant below the short-term 20-day and 50-day moving average and increasing across time. Thus, we can be positive about the stock market price in future years as the market is retrieving back from the pandemic. And thereby, the most ideal investment for people at this time would be long-term given this potential increase in price rather than short due to the random fluctuations.

Stock Universe Under Consideration – the Aggressive Stocks Forecast
In this report, we conduct testing for the Aggressive stocks that I Know First cover by its algorithmic forecast in the Aggressive stocks package. The period for evaluation and testing is from 1st April 2020 to 17th June 2021. During this period, we were providing our clients with daily forecasts for the Aggressive stocks and the time horizons which we evaluate in this report are six periods spanning from 3 days to 1 year.
Evaluating the Signal Indicator for the Aggressive Stocks Forecast
In this section, we will demonstrate how our stock-picking method can improve if we add the signal indicators.

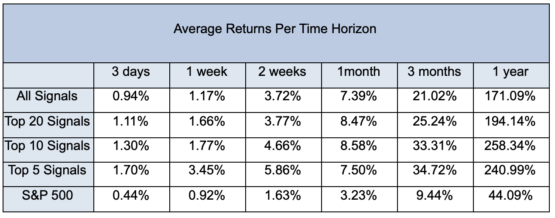
From Table 1, we can see that the average returns are generally increasing with signal strength filters applied on Aggressive stocks for all time horizons. All four signal groups tend to generate greater returns compared to the S&P 500. Particularly, the highest return reaches 258.34% on a 1-year time horizon, which beats the S&P 500 benchmark (44.09%) with a premium return of 214.25%.


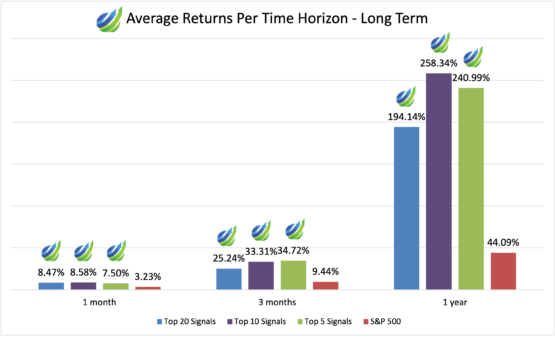

If we look at the average returns in terms of the time horizon perspective using the graphs above, it is clear that the returns go higher along with a longer time horizon. Moreover, the long-term average returns outperformed the market by a substantial amount compared with the short-term performance in the same signal strength group. This happens for all the signal filters applied. The highest average returns all come from the 1-year forecasts: for the Top 20 Signals – 194.14%, higher than S&P by 150.31%; for the Top 10 Signals – 258.34%, higher than S&P by 214.25%; for the Top 5 Signals – 240.99%, higher than S&P by 196.9%.
In general, a stronger signal filter and a longer time horizon tend to offer greater returns and market premiums. As seen in Table 2 and bar charts above, the lowest average return in this table comes from All Signals on a 3-days time horizon, and the highest average return falls on the Top 10 Signals in 1 year. Furthermore, it is critical to note that Aggressive stocks will be impacted by market volatility with a higher degree of risk. This influence is also negative as shown in our evaluation since we tend to get lower returns for short-term forecasts. Therefore, it is ideal to use a long-term time horizon when investing with an aggressive strategy. This allows investors to take advantage of the relationship between volatility and time, and thereby ride out the market fluctuations and generate more returns and profits.
Hit Ratio Per Time Horizon Analysis
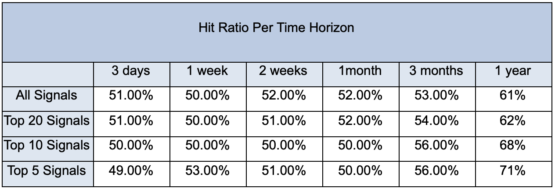

According to Table 2, we achieved stable Hit Ratios for all forecasts during the pandemic year. It is interesting to note that the top Hit Ratio performances are all from the 1-year forecasts for all Signal Filters, ranging from 62% to 71%. By looking at Table 1 simultaneously, for this 1-year time horizon, these large Hit Ratios also bring notable average returns surpassing the short-term returns. Besides, the Hit Ratios for all Signal Filters are outpacing the benchmark extensively with positive and high returns both in short time frames and long time frames.
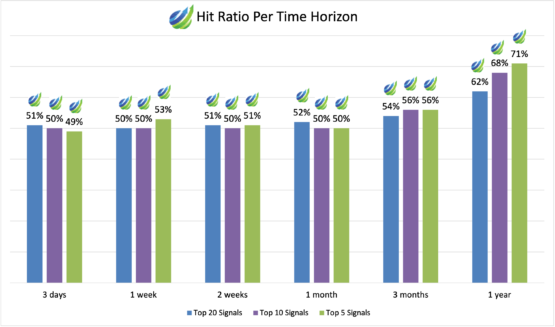

Based on Figure 3, we can notice that the lowest predictability comes from the Top 5 signals on a 3-day time horizon, and the highest predictability is from the Top 5 Signals on a 1-year time horizon. It is interesting to notice that the highest return comes not from the highest hit ratio on a 1-year time horizon. So, an investor has a choice between return and risk on a 1-year time horizon: the highest return comes from the Top 10 signals, while the highest hit ratio comes from the Top 5 signals.
The COVID-19 pandemic is having a significant impact on the US stock market volatility at this time, and this market volatility is also considerably influencing the aggressive stocks as they have a larger potential for losses compared to the conservative stocks. Hence, taking a long-term investment strategy tends to be more advantageous when people can time their investments to come through market fluctuations.
Conclusion
In a nutshell, this evaluation report exhibits the performance of I Know First’s algorithm for the Aggressive stocks from 1st April 2020 to 17th June 2021. The algorithm is outperforming the benchmark index throughout the time periods. The I Know First algorithm has obtained the best performance for the 1-year time horizon. Due to the high volatility of aggressive stocks, having a long-term investment outlook is ideal. Furthermore, we could see a recovery sign of the US stock market since March 2020 as the S&P 500 stock index has been increasing with only some slight fluctuations. Therefore, we can be positive about the potential in stock market prices rising in future years and can be confident in making long-term investments with the I Know First algorithm.