

I Know First Live forecast evaluation: Extensive Portfolio Evaluation Using Stock Picking Based On S&P 500 Universe


Executive Summary
In this Live Forecast Evaluation Report, we will examine the performance of the forecasts generated by the I Know First AI Algorithm for the S&P 500 stock universe. Our analysis covers the time period from August 18, 2015 – August 06, 2018. We present below the optimal stock picking strategy for this period.
Strategy Evaluation
We perform backtesting on different time horizons and compare it with the SPY benchmark. The portfolios under consideration were structured under constraint to include only include long positions for all stocks.


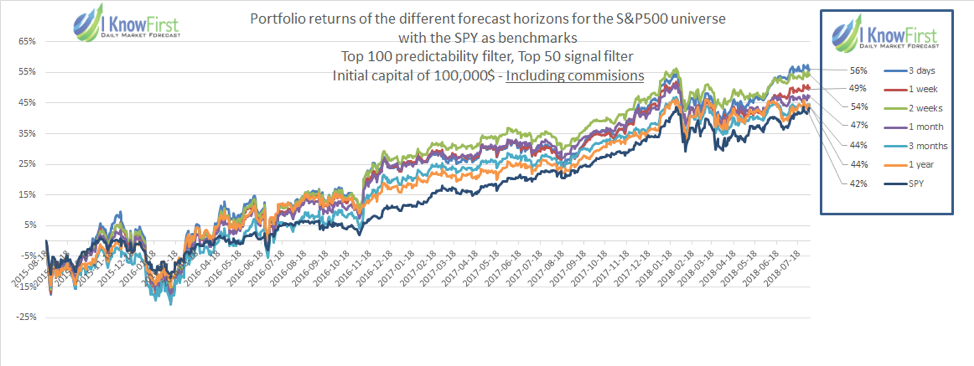
- From February 2016 following the proposed stock picking method provides a continued consistent performance output
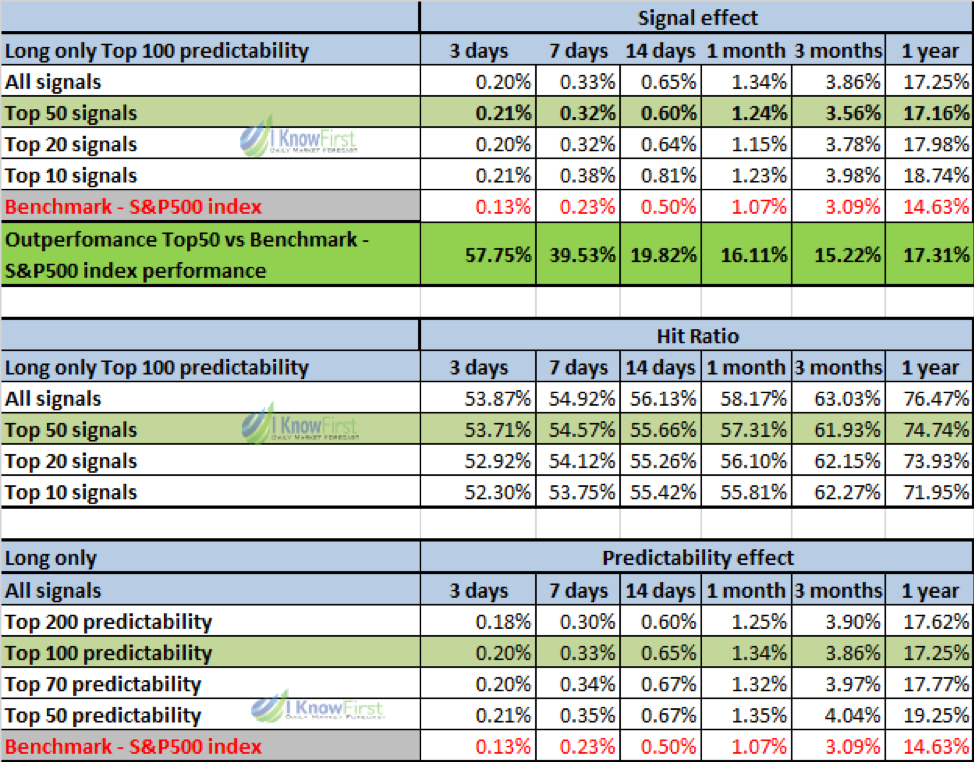
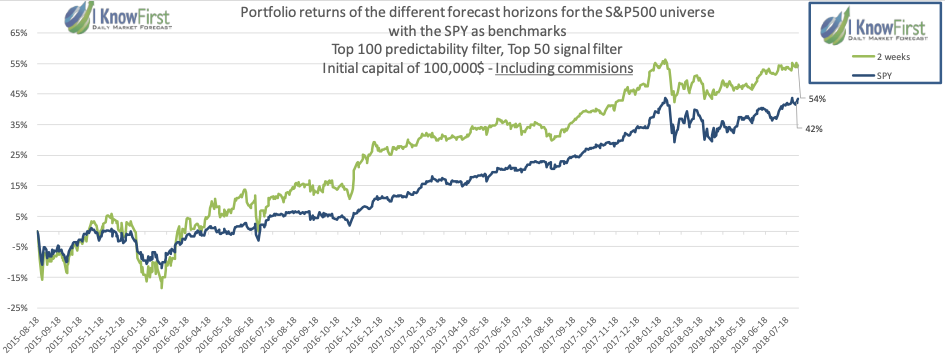
- The two-week and three day times horizons with the top 100 predictability filter and the top 50 signal filter provided the best results
- The 3 day horizon provides a 56% return and the two week horizon a 54% increase compared to the 42% of the SPY benchmark.
Portfolio Composition By Sector
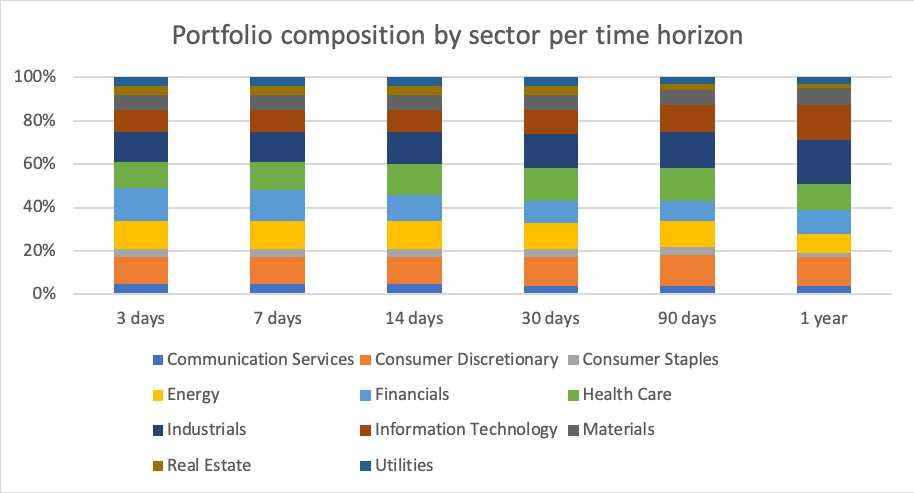

The chart above illustrates a diversified composition of the portfolio. Even though the stock picking method is not explicitly subject to diversification, we can observe above levels of diversification resulting from the proposed stock picking methods.
About the I Know First Algorithm
The I Know First self-learning algorithm analyses, models, and predicts the stock market. The algorithm is based on Artificial Intelligence (AI) and Machine Learning (ML) and incorporates elements of Artificial Neural Networks and Genetic Algorithms.


The system outputs the predicted trend as a number, positive or negative, along with a wave chart that predicts how the waves will overlap the trend. This helps the trader to decide which direction to trade, at what point to enter the trade, and when to exit. Since the model is 100% empirical, the results are based only on factual data, thereby avoiding any biases or emotions that may accompany human derived assumptions. The human factor is only involved in building the mathematical framework and providing the initial set of inputs and outputs to the system. The algorithm produces a forecast with a signal and a predictability indicator. The signal is the number in the middle of the box. The predictability is the number at the bottom of the box. At the top, a specific asset is identified. This format is consistent across all predictions.
Our algorithm provides two independent indicators for each asset – Signal and Predictability.
The Signal is the predicted strength and direction of movement of the asset. Measured from -inf to +inf.
The predictability indicates our confidence in that result. It is a Pearson correlation coefficient between past algorithmic performance and actual market movement. Measured from -1 to 1.
Here is the detailed description of the heatmap.
Our Stock Picking Method
The method in this evaluation is as follows:
We take the top X most predictable assets, and from them we pick the top Y highest signals.
By doing so we focus on the most predictable assets on the one hand, while capturing the ones with the highest signal on the other.
For example, a top 100 predictability filter with a top 50 signal filter means that on each day we take only the 100 most predictable assets, and then we pick from them the top 50 assets with the highest signals.
The Performance Evaluation Method
We perform evaluations on the individual forecast level. It means that we calculate what would be the return of each forecast we have issued for each horizon in the testing period. Then, we take the average of those results by strategy and forecast horizon.
For example, to evaluate the performance of our 1-month forecasts, we calculate the return of each trade by using this formula:
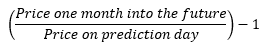

This simulates a client purchasing the asset based on our prediction and selling it exactly 1 month in the future.
We iterate this calculation for all trading days in the analysed period and average the results.
Note that this evaluation does not take a set portfolio and follow it. This is a different evaluation method at the individual forecast level.
Performance evaluations
In the following charts you will see proof that our predictability and signal indicators can be used to beat the benchmark and obtain alpha.
We will start by investigating the influence of the I Know First signal indicator on the trade results.
In the following chart you can see out-performance of our Top 50 strategy compared to the S&P500 index benchmark.
Performance Summary

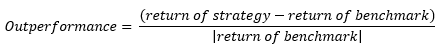
The out-performance is measured by the following formula:

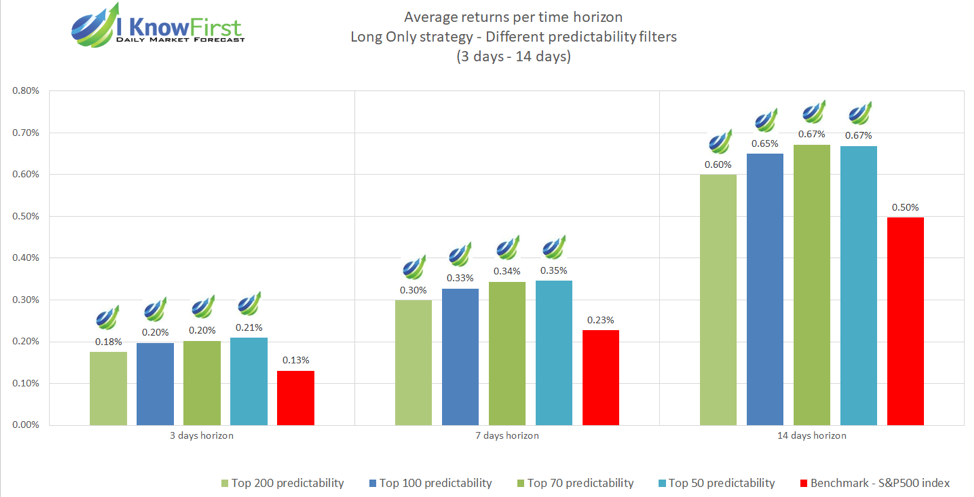
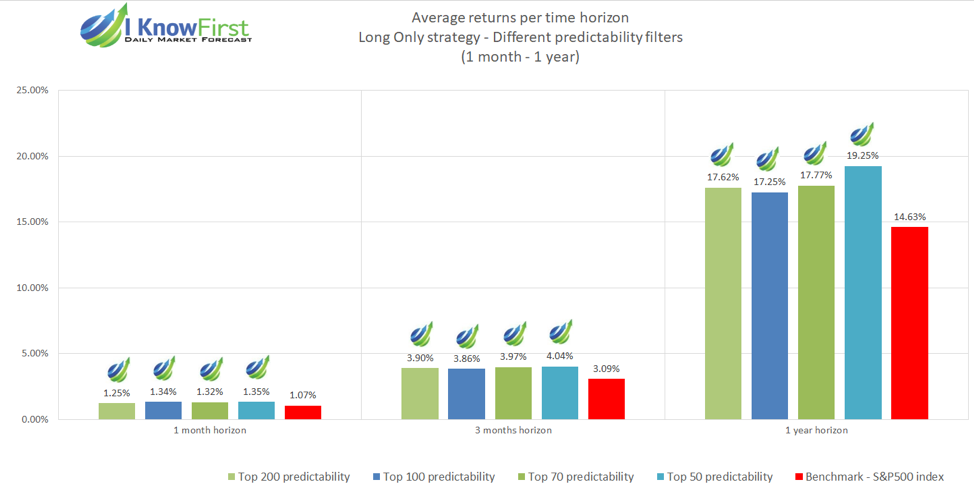
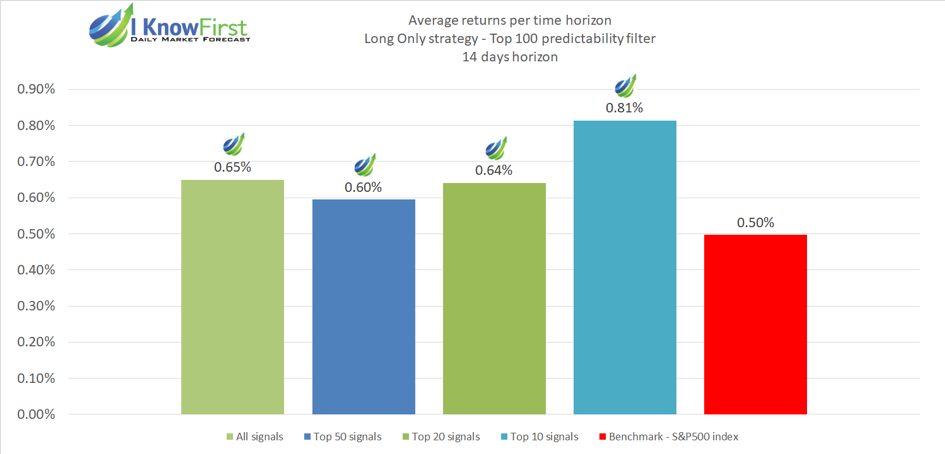
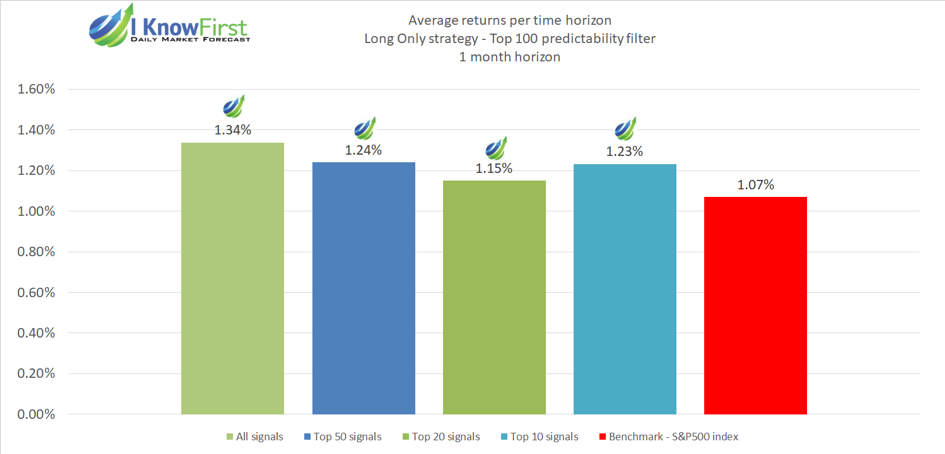
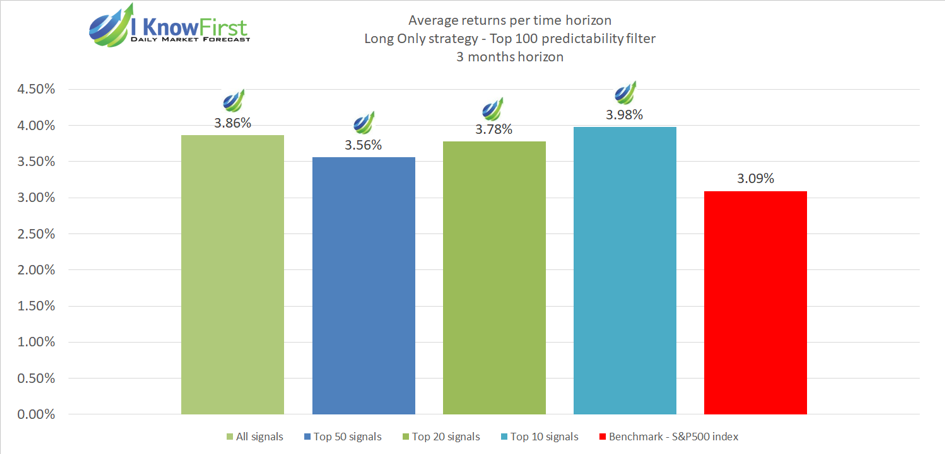
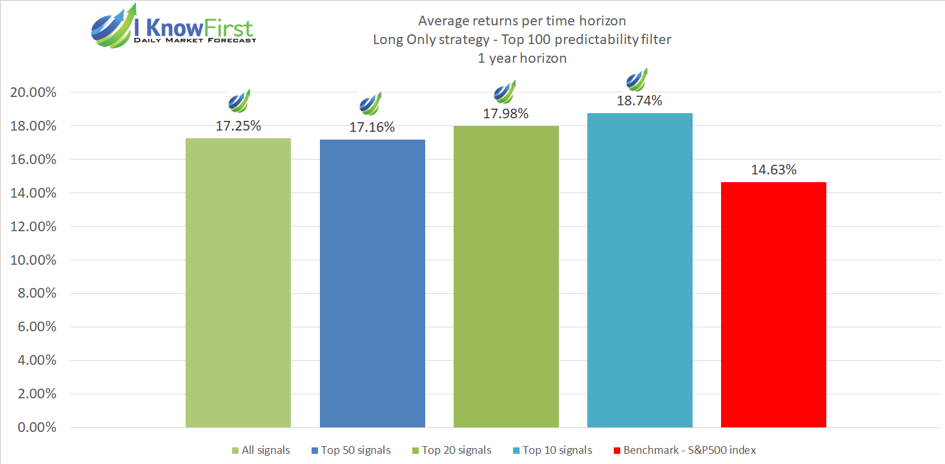
Average returns per time horizon for different predictability filters


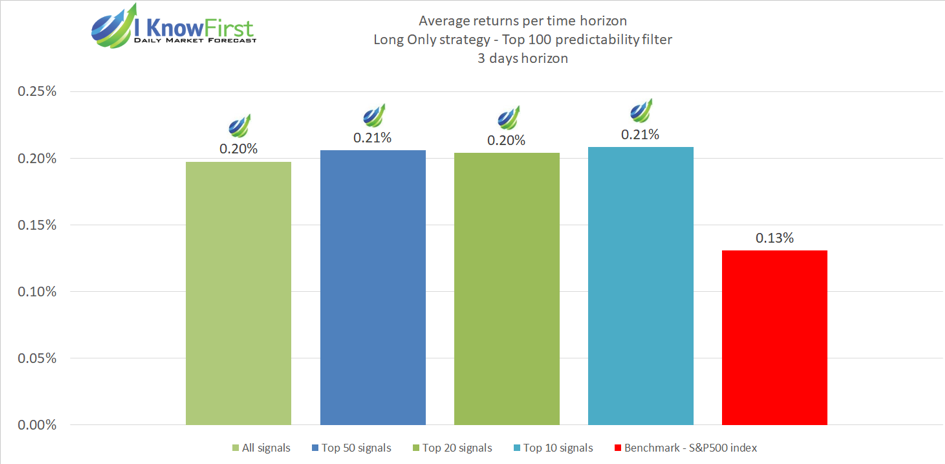
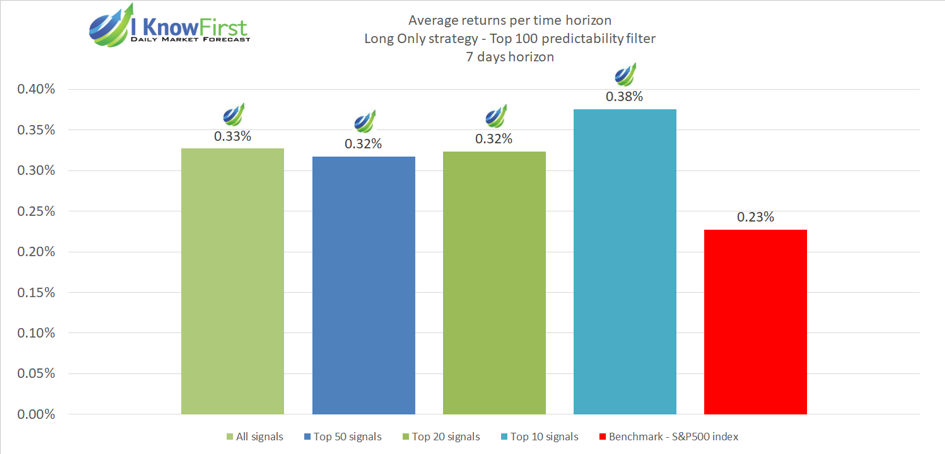
S&P500 – Top 100 most predictable assets – Different time horizons
S&P500 – Average hit ratio – Top 100 predictability filter – Top 50 signal
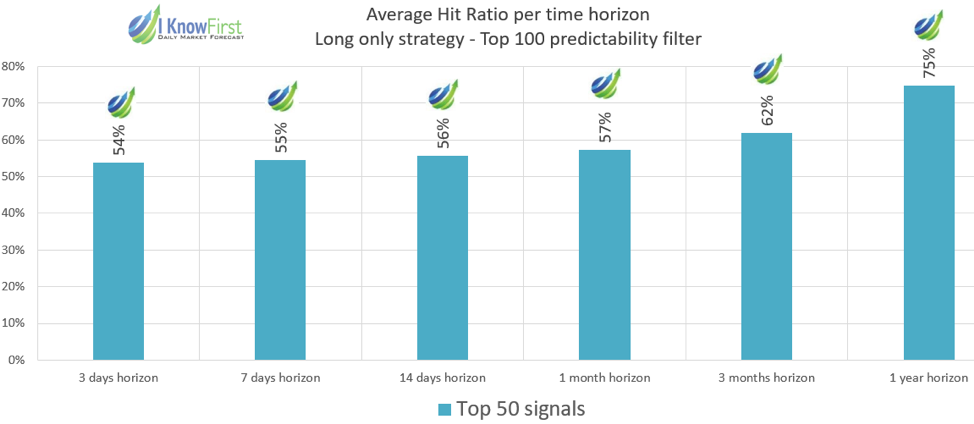

The above clearly shows to what extent the hit ratio can exceed 50% when following the I Know First signal and predictability indicators and it further shows that the longer the time horizon is, the higher the hit ratios become.
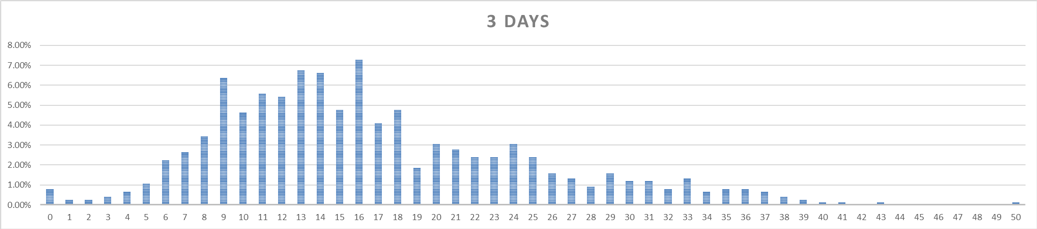
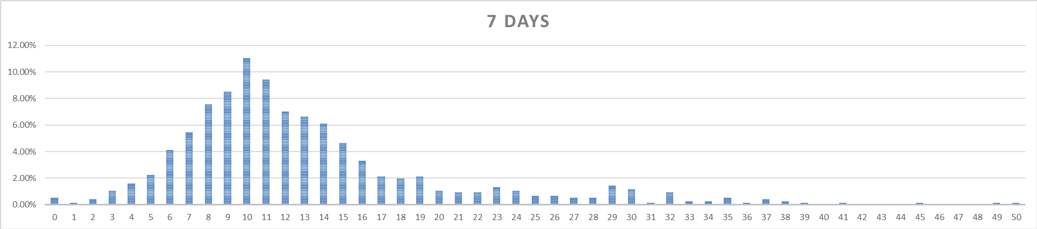
Replaced tickers analysis
We analysed further the number of tickers that are replaced each day in the Top 50 tickers picked as described in Our stock picking method section.
We did this for each time horizon and the results are shown below:
Number of replaced tickers – Top 100 predictability – Top 50 Signals – Different time Horizons
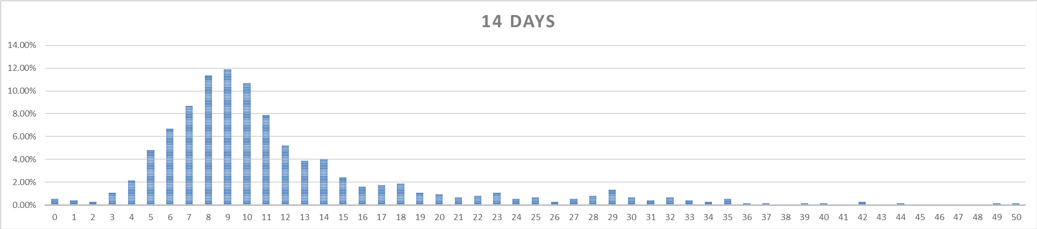
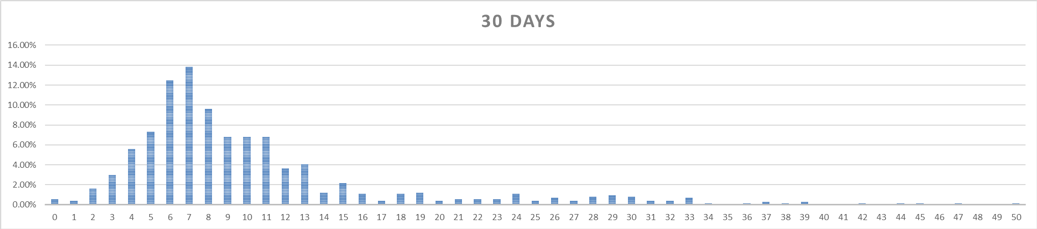
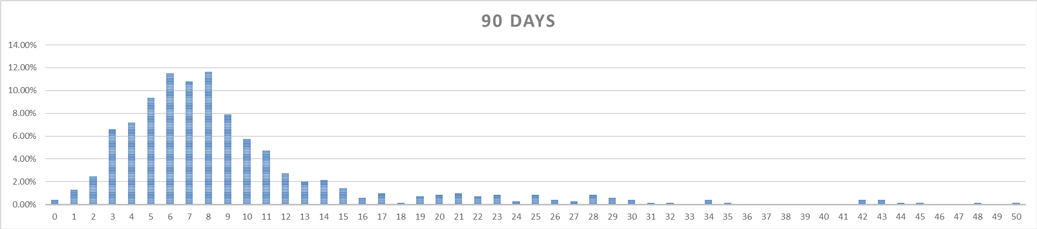
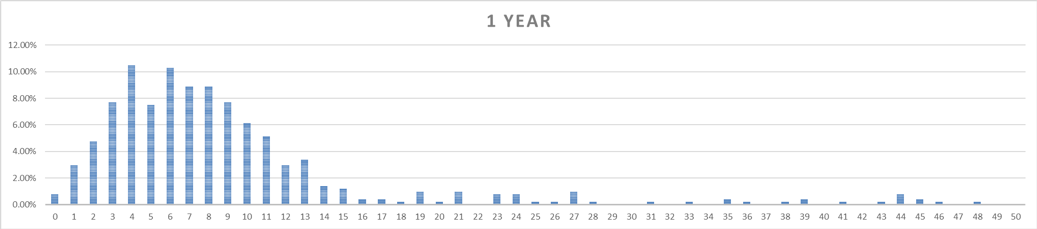
We observe clear and persistent tendency of less replacements in Top 50 stocks set as the time horizon is longer. This result provides solid grounds for two staging filtering technique (by filter and by signal) to be applied using forecasts for long horizons, rather than short ones, as it achieves the most stable composition of the portfolio.
Algorithm backtesting results – 14 days’ time horizon forecasts signal and predictability used for stock picking

Equity curve for a sample trading strategy
As part of this report we want to consider application of the above predictability and signal data to form a simple trading strategy:
Stock pool: We take the same Top 100 most predictable assets and from them we filter the top 50 highest signals, in the exact same way shown in the above statistics (Section 4.3). This gives us a pool of 50 stocks that we can buy each day.
Financial set-up: We start with an initial capital of $100K and every day we hold a portfolio of up to 50 stocks. We assign each 2% of the portfolio. We added commissions of 0.005$ per share (Standard Interactive Brokers fee)
Buy criteria: If there are less than 50 stocks in the portfolio, buy the ticker with the highest signal from among the Top 50 of that day as described above.
Sell criteria: If on that day this stock is not in the top 50 of this time horizon, we check if it is in the top 50 of one of the shorter time horizons. If it is not, we sell it. Otherwise we hold.
Each of the equity curves shown below represents the return of the above strategy going forward with a specific time horizon. For example; 1-month horizon equity curve shows strategy performance when it is applied using 1-month forecasts as a basis for initial portfolio composition and further buying/selling decisions. Below we provide an example of investor’s decision algorithm to act on buying/selling of stock in a portfolio:
If a stock is no longer in the Top 50 of the 1-month horizon, the investor will check if it is in the Top 50 of the 2-week horizon, if it is not, he checks the 1-week horizon, if it is not, then the 3-day horizon’s Top 50. Only if the stock is not in any of the Top 50s in the shorter time horizons, the investor will sell this asset and replace it with the top asset from the stock pool of that day.
This strategy allows the investor to stay in positions longer to avoid frequent portfolio adjustments.
Top 100 predictability- Top 50 signals. Sell if not in Top 50 of all shorter horizons

Sectorial distribution
In this section we will examine the sectorial composition of the stocks in the portfolios shown in section above. Note that our stock selection method did not try to deliberately diversify the sectorial composition and this can easily be improved further. Based on this data we present the average sectorial distributions of the stocks within those portfolios:
Sectorial composition summary
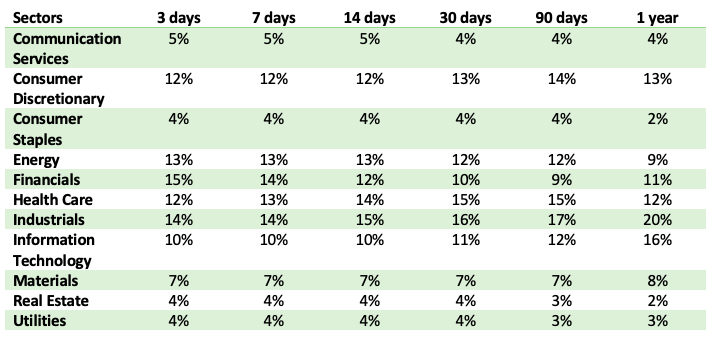

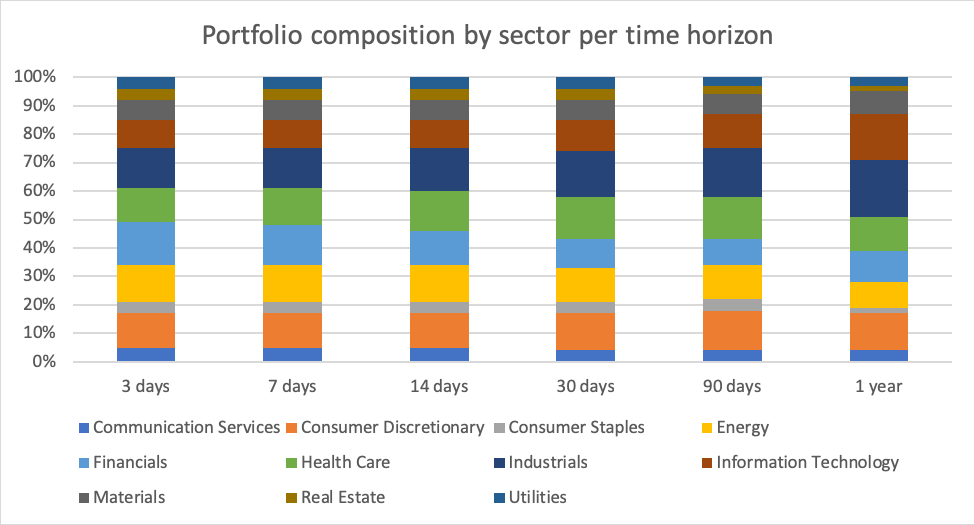

As we see, the distribution does not change significantly across the different time horizons. At the same time, it is clear that although there are dominating sectors (e.g. “Consumer Discretionary”, “Energy” or “Financials”) their share reaches 20% at max assuring a reasonable degree of sectorial diversification across the portfolio. Note, that this portfolio compositions are solely achieved by applying predictability and signal filters as criteria for buying/selling stocks and therefore the above diversification level was achieved automatically. If an investor has specific target composition of portfolio in terms of sectorial distribution of stocks, the stock picking process can be adjusted and then the target composition could be set as a constraint to be used in addition to the predictability and signal criteria.
Please see Annex 1 for additional pie charts illustrating composition of portfolio for a specific time horizon.
Summary
The goal of this analysis is to demonstrate the out-performance of the Top 50 I Know First picked stocks over the S&P 500 index. This analysis shows that for all the different time horizons, using I Know First’s indicators to pick stocks outperforms the market. However, the best performance of 54% was based on the results of backtesting is shown by stock picking strategy which utilized 14 days forecasts as basis for buy/sell decisions.