

I Know First Evaluation Report For Interest Rates Assets Universe
Executive Summary
In this Forecast Evaluation Report, we will examine the performance of the forecasts generated by the I Know First AI Algorithm for the Interest Rates assets market that we send to our customers on a daily basis. Our analysis covers the time period from 1 January 2019 to 30 June 2019.

Interest Rates Assets Highlights:
- Top 5 signals provided the most predictable stocks with a return of 4.85% in a 3-month investment horizon, beating the benchmark by 4.29%.
- There is a clear positive correlation between increasing time horizons and heightened investment returns.
- The benchmark was over-performed in the top 20, 10 and 5 signal classes for every time horizon – from 3 days all the way up to 3 months.
The above results were obtained based on the stock forecast evaluation over the specific time period using consecutive filtering approach – by predictability, then by signal, to give a general overview of the forecasting capabilities of the algorithm for the Interest Rate assets universe. The following sections of this study will develop the analysis and the data behind the above results and provide you with a deeper understanding of the Methodology and the filtering results for different subsets of assets.
About the I Know First Algorithm
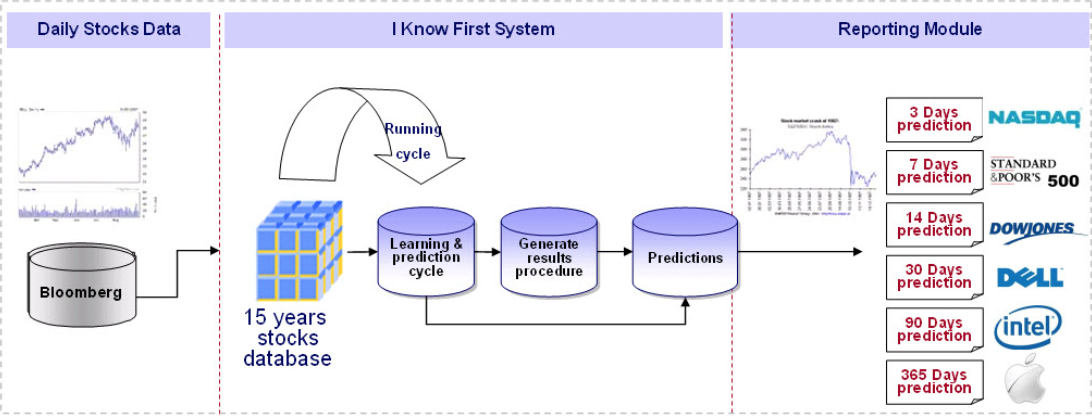

The I Know First self-learning algorithm analyzes, models, and predicts capital markets, including currencies, stocks, commodities, interest rates, and bond markets. The algorithm is based on Artificial Intelligence (AI) and Machine Learning (ML) and incorporates elements of Artificial Neural Networks and Genetic Algorithms.
The system outputs the predicted trend as a number, positive or negative, along with a wave chart that predicts how the waves will overlap the trend. This helps the trader to decide which direction to trade, at what point to enter the trade, and when to exit. Since the model is 100% empirical, the results are based only on factual data, thereby avoiding any biases or emotions that may accompany human-derived assumptions. The human factor is only involved in building the mathematical framework and providing the initial set of inputs and outputs to the system. The algorithm produces a forecast with a signal and a predictability indicator. The signal is the number in the middle of the box. The predictability is the number at the bottom of the box. At the top, a specific asset is identified. This format is consistent across all predictions.
Our algorithm provides two independent indicators for each asset – Signal and Predictability.
The signal is the predicted strength and direction of movement of the asset. This is measured from -inf to +inf.
The predictability indicates our confidence in that result. It is a Pearson correlation coefficient between past algorithmic performance and actual market movement. This is measured from -1 to 1.
You can find the detailed description of our heatmap here.
The Interest Rates Asset Picking Method
The method in this evaluation is as follows:
We take the top X most predictable Interest Rate assets from the Interest Rates universe, and from them, we pick the top Y assets with the highest signals.
By doing so we focus on the most predictable assets on the one hand, while capturing the ones with the highest signal on the other.
For example, a top 30 predictability filter with a top 10 signal filter means that on each day we take only the 30 most predictable assets, and then we pick from them the top 10 assets with the highest absolute signals.
We use absolute signals since these strategies are long and short ones. If the signal is positive, then we buy and, if negative, we short.
The Performance Evaluation Method
We perform evaluations on the individual forecast level. It means that we calculate what would be the return of each forecast we have issued for each horizon in the testing period. Then, we take the average of those results by strategy and forecast horizon.
For example, to evaluate the performance of our 1-month forecasts, we calculate the return of each trade by using this formula:
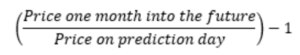

This simulates a client purchasing the asset based on our prediction and selling it exactly 1 month in the future.
We iterate this calculation for all trading days in the analyzed period and average the results.
Note that this evaluation does not take a set portfolio and follow it. This is a different evaluation method at the individual forecast level.
The Benchmarking Method
The theory behind our benchmarking method is the “Null hypothesis“, meaning buying every asset in the particular asset universe regardless of our I Know First indicators.
In comparison, only when our signals are of high signal strength and high predictability, then the particular interest rates should be bought.
The ratio of our signals trading results to benchmark results indicates the quality of the system and our indicators.
Example: A benchmark for the 3 days horizon means buy on each day and sell exactly 3 business days afterwards. We then average the results to get the benchmark. This is to conduct an apples to apples comparison.
Universe Under Consideration –
Interest Rates Assets
In this report, we highlight our testing for the over 40 interest rate assets covered by I Know First in the “Interest Rates” package. This package includes the major country-specific interest rate assets, such as the US 30-year T-bills and the Canadian Western Bank notes. The full universe coverage could be found at the end of this article.
Performance: Evaluating The Predictability Indicator
We conduct our research for the period from 1 January 2019 to 30 June 2019. Using the methodology described in the previous sections, we start our analysis by computing the performance of the algorithm’s signals for time horizons ranging from 3 days to 3 months, considering the predictability indicator solely. We applied filtering by the predictability indicator for different levels to investigate its sole marginal contribution in terms of return, and we observe how returns change as these different filters are applied. Afterward, we calculated the returns for the same time horizons for the benchmark using the interest rates universe and compare it against the performance of the filtered sets of assets. Our findings are summarized in the table (Table 1) below:
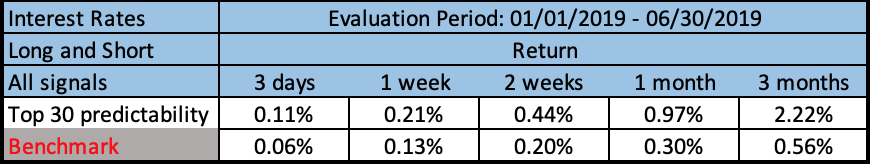

From the above table, we can observe that Top 30 assets filtered by predictability generally provided all substantially positive returns whereas the benchmark provided moderately positive returns. The return on investment for the Top 30 assets increases by 2.11% from 3 days to 3 months, while the return from 1 month to 3 months in the Top 30 assets had the largest increase of 1.25%. In contrast, the return on investment for the benchmark only increased by 0.50% from 3 days to 3 months. Returns based on predictability outperform the benchmark significantly, by up to 1.66% on the 3 months time horizon. The maximum performance was recorded for Top 30 interest rates at the 3-month horizon with a return of 2.22%. After analyzing the predictability filtering effect on interest rates assets’ return, we continue our study in order to identify whether the results could be improved in the case of Top 30 interest rates assets when we filter the set by signal indicators.
Performance: Evaluating the Signal Indicator
In this section, we will demonstrate how adding the signal indicator to our asset picking method improves the above performance even further. It is important to measure the performance of our strategy with respect to the benchmark, and for that, we will apply the formula:

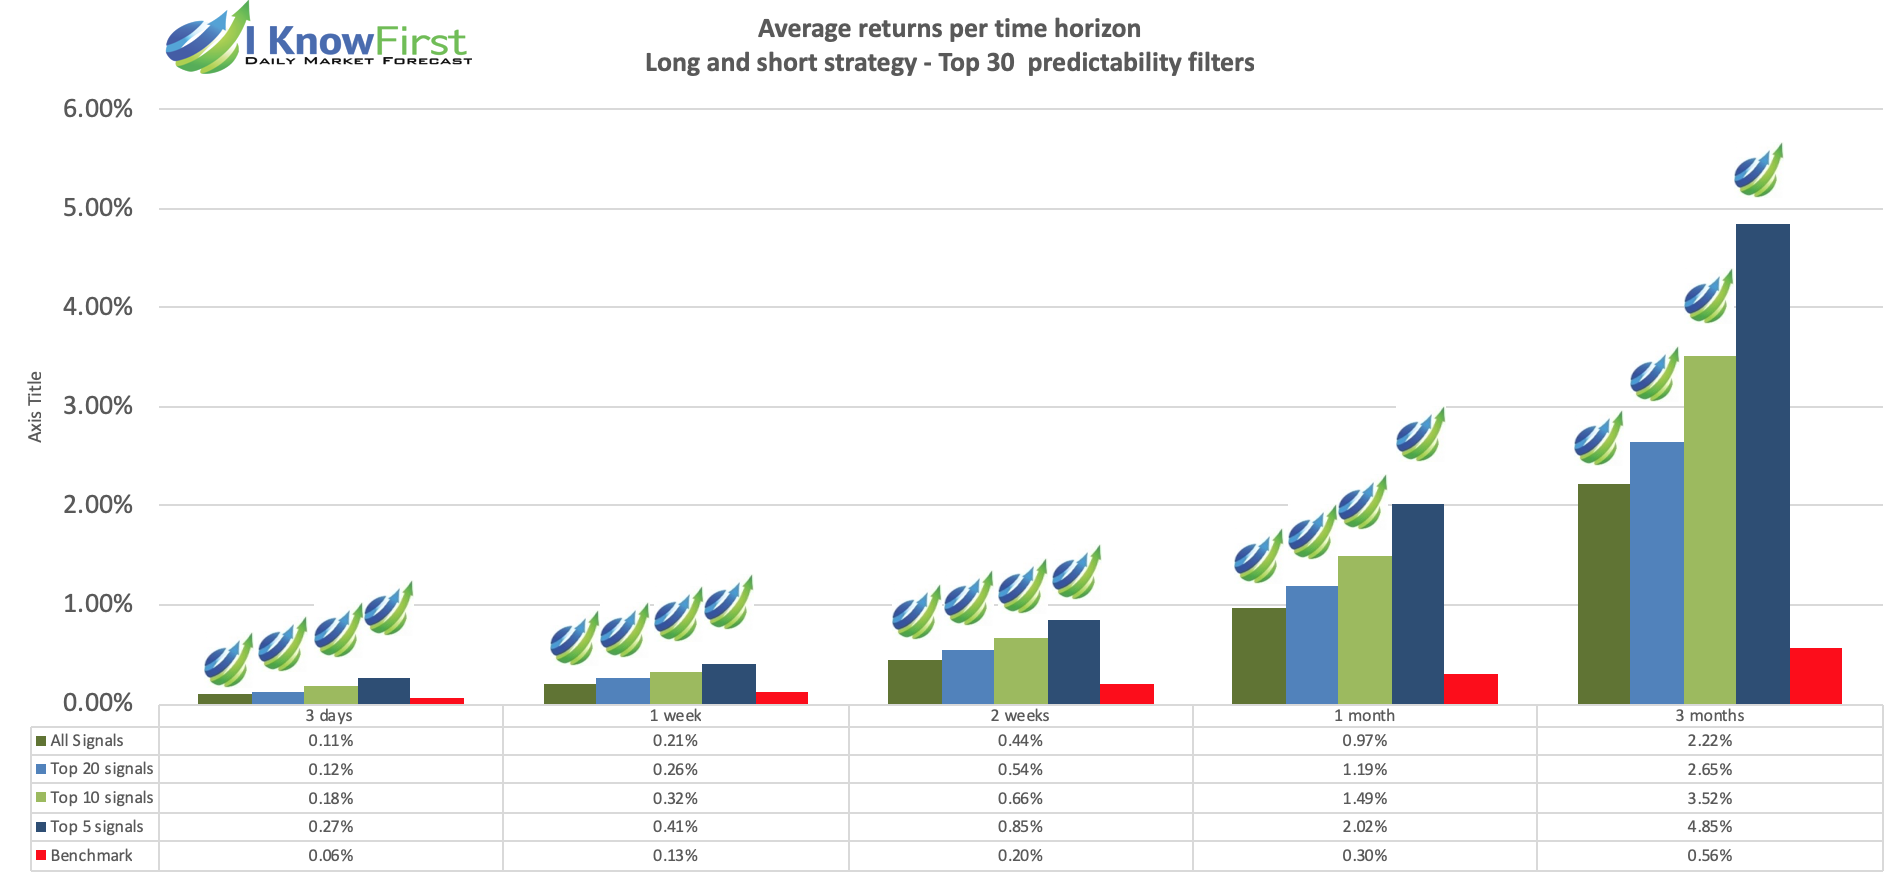
We further filtered the assets based on signal strength to the Top 30 assets, which were previously already filtered by predictability. The results of the testing showed that there is a significant positive marginal effect on the assets’ return, especially in the case of the 1 month and 3-month investment horizons. We present our findings in the following table and charts.
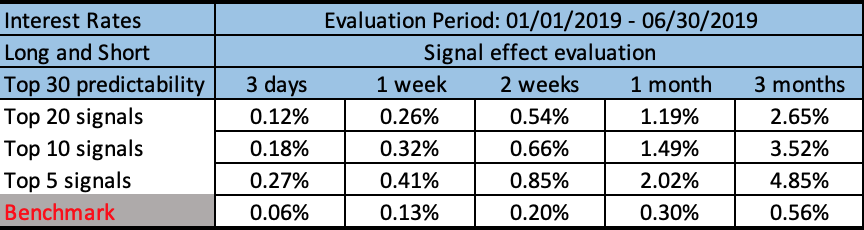

Table 1. Interest Rates assets’ return after Signal filtering
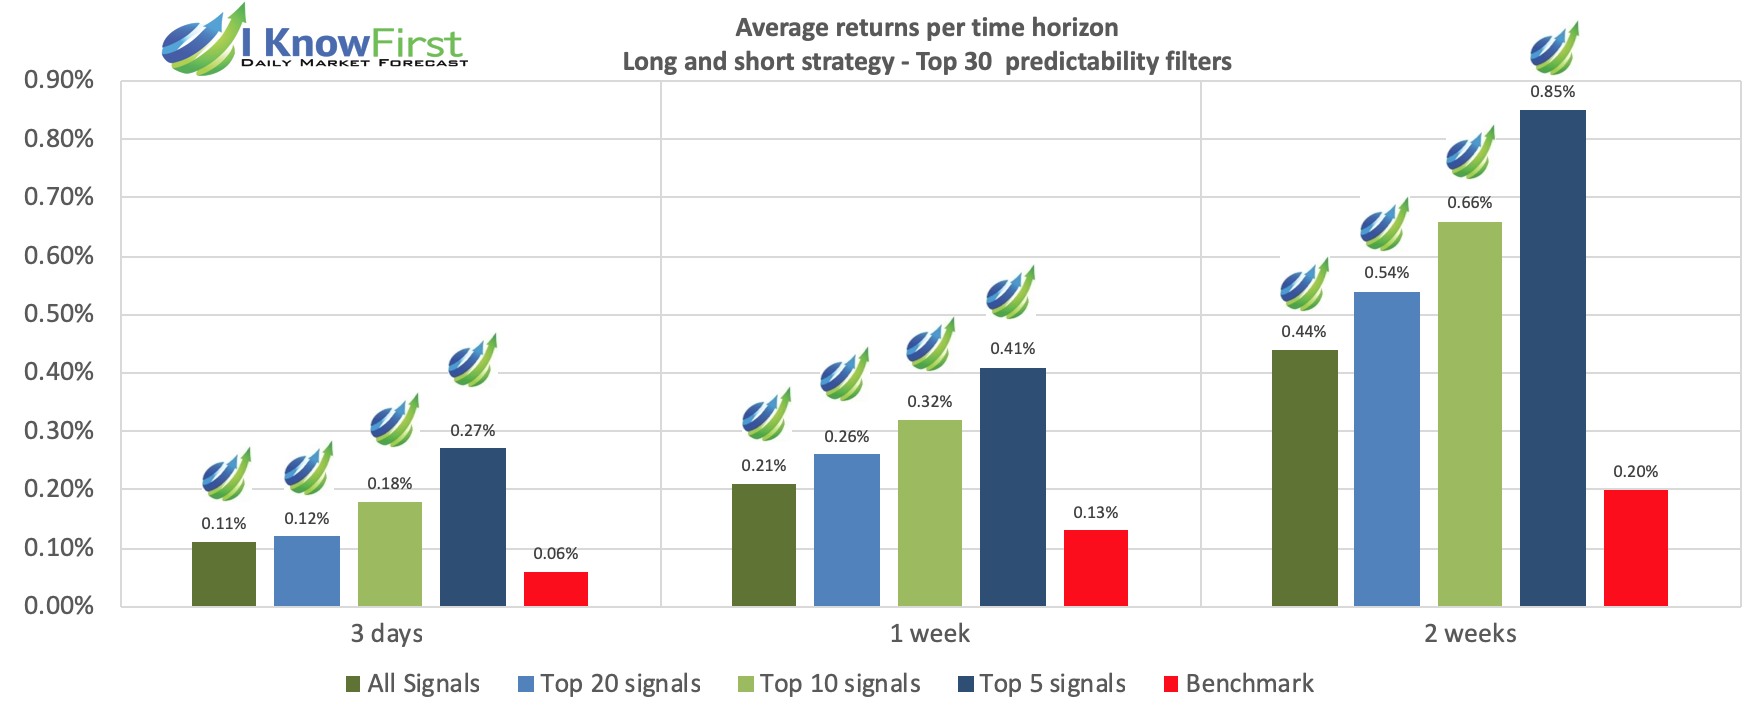

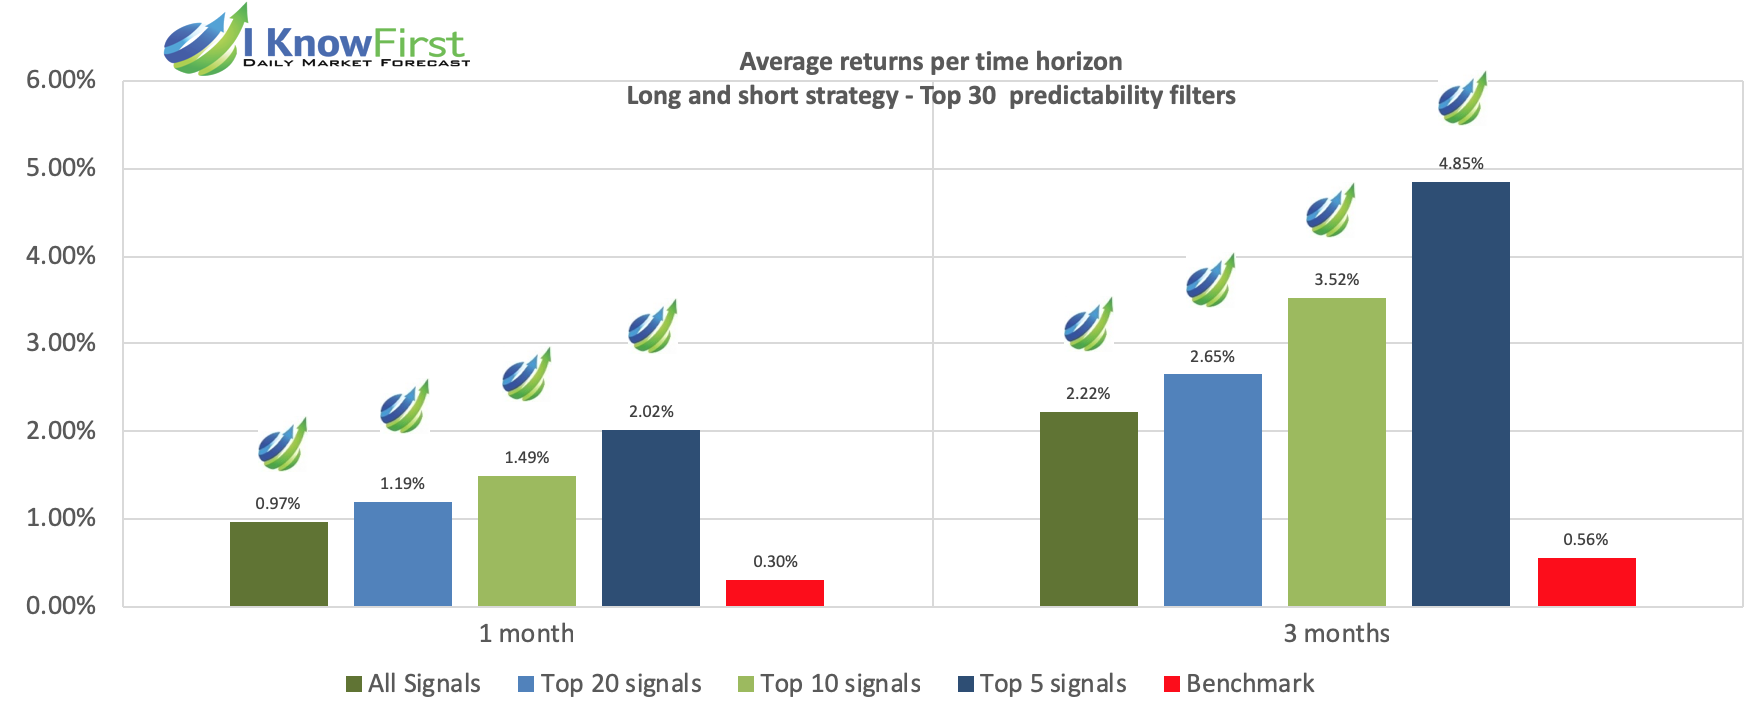

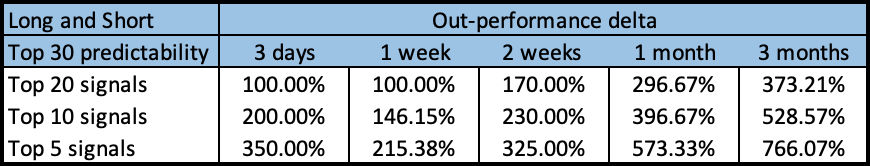

Table 2. Interest Rates assets’ out-performance after Signal filtering
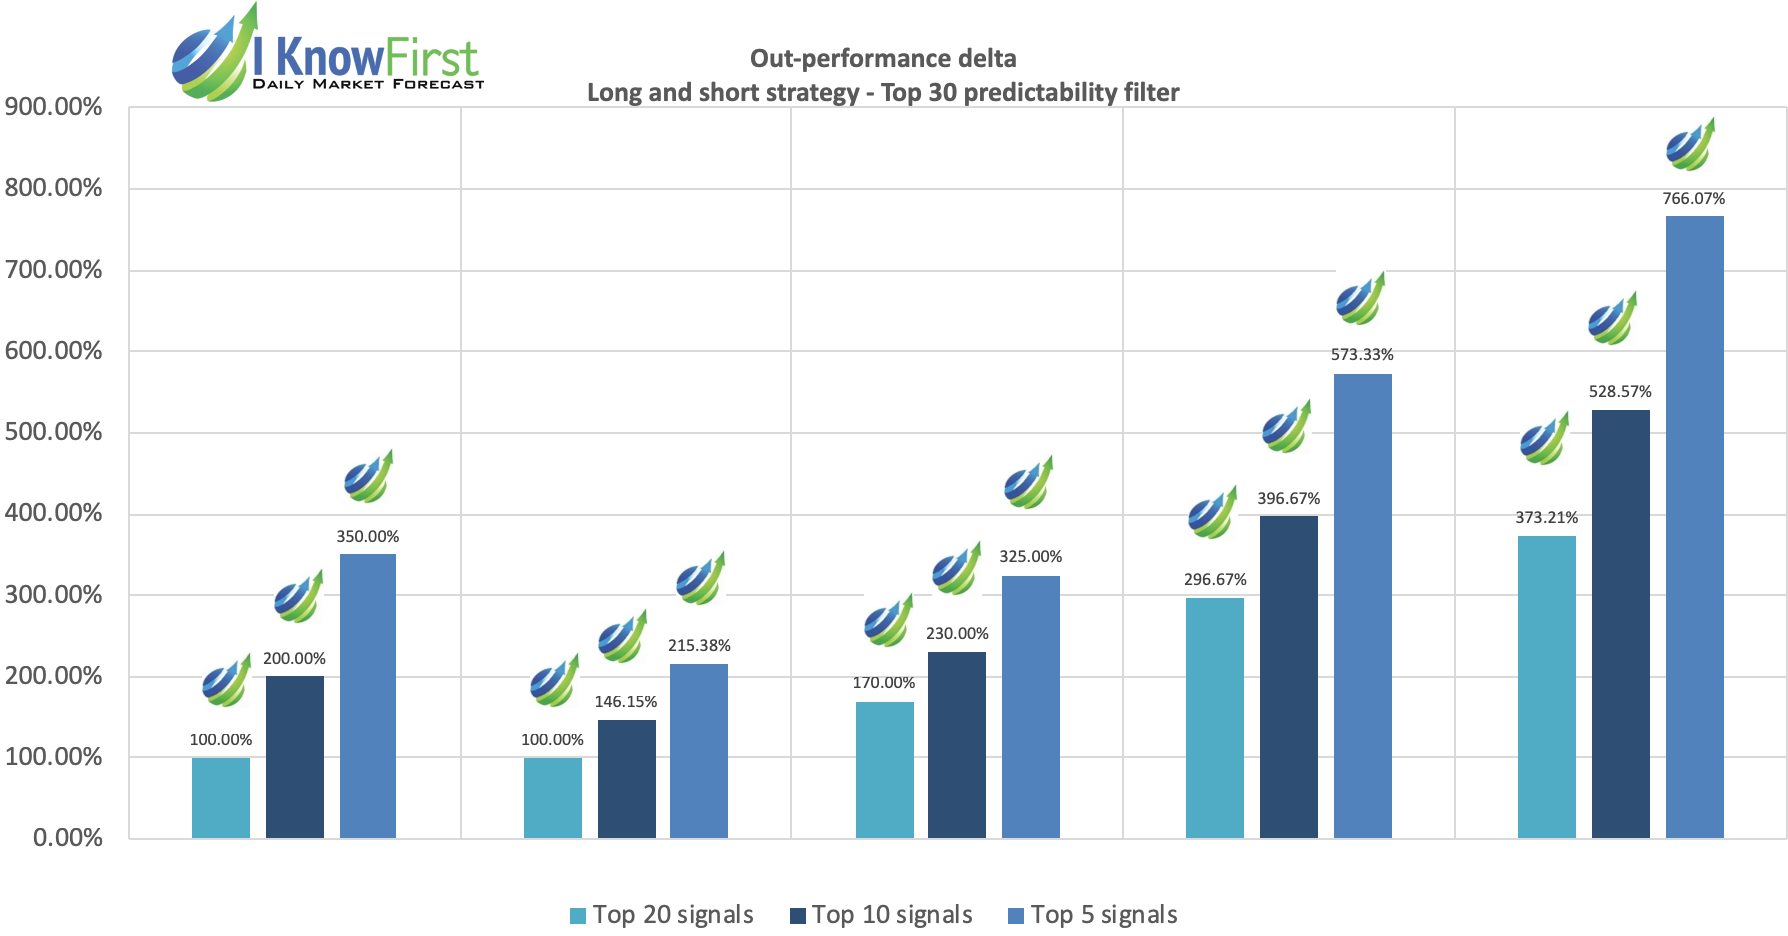

From the above set of charts, we can observe that if we apply signal strength filtering to the interest rates universe, all subsets of the Top 30 predictability signals subset – namely, the Top 20, Top 10 and Top 5 signals – seem to immediately produce even greater returns than the benchmark. We see that marginal returns are immediate from 3 days horizon onwards for all signal categories. Overall, the Top 5 signal category seems to be the best performing with its returns following a steep upward trend.
The returns of all categories increase greatly for longer time horizons from a period of 3 days to 3 months. 3-month returns went up to 4.85% for the Top 5 signals. When we compare the average returns after applying the algorithm from I Know First with benchmark returns, we see that the signals are actually very effective. In all cases, the Top 20, Top 10 and Top 5 signals perform much better than the benchmark. This is especially true for the Top 5 signals, which notably outperformed the benchmark by 350% after 3 days, and by 766% after 3 months. As observed, there is an upward trend. As the time horizon increases from 3 days to 3 months, the returns increased. As the signal strength increased from Top 30 to Top 5, the returns also increased greatly. One can see that following the signals from the I Know First interest rates package presents opportunities for much higher returns. This seems to be especially true in short-term periods of 3 days as well as long term periods of 1 and 3 month time horizons.
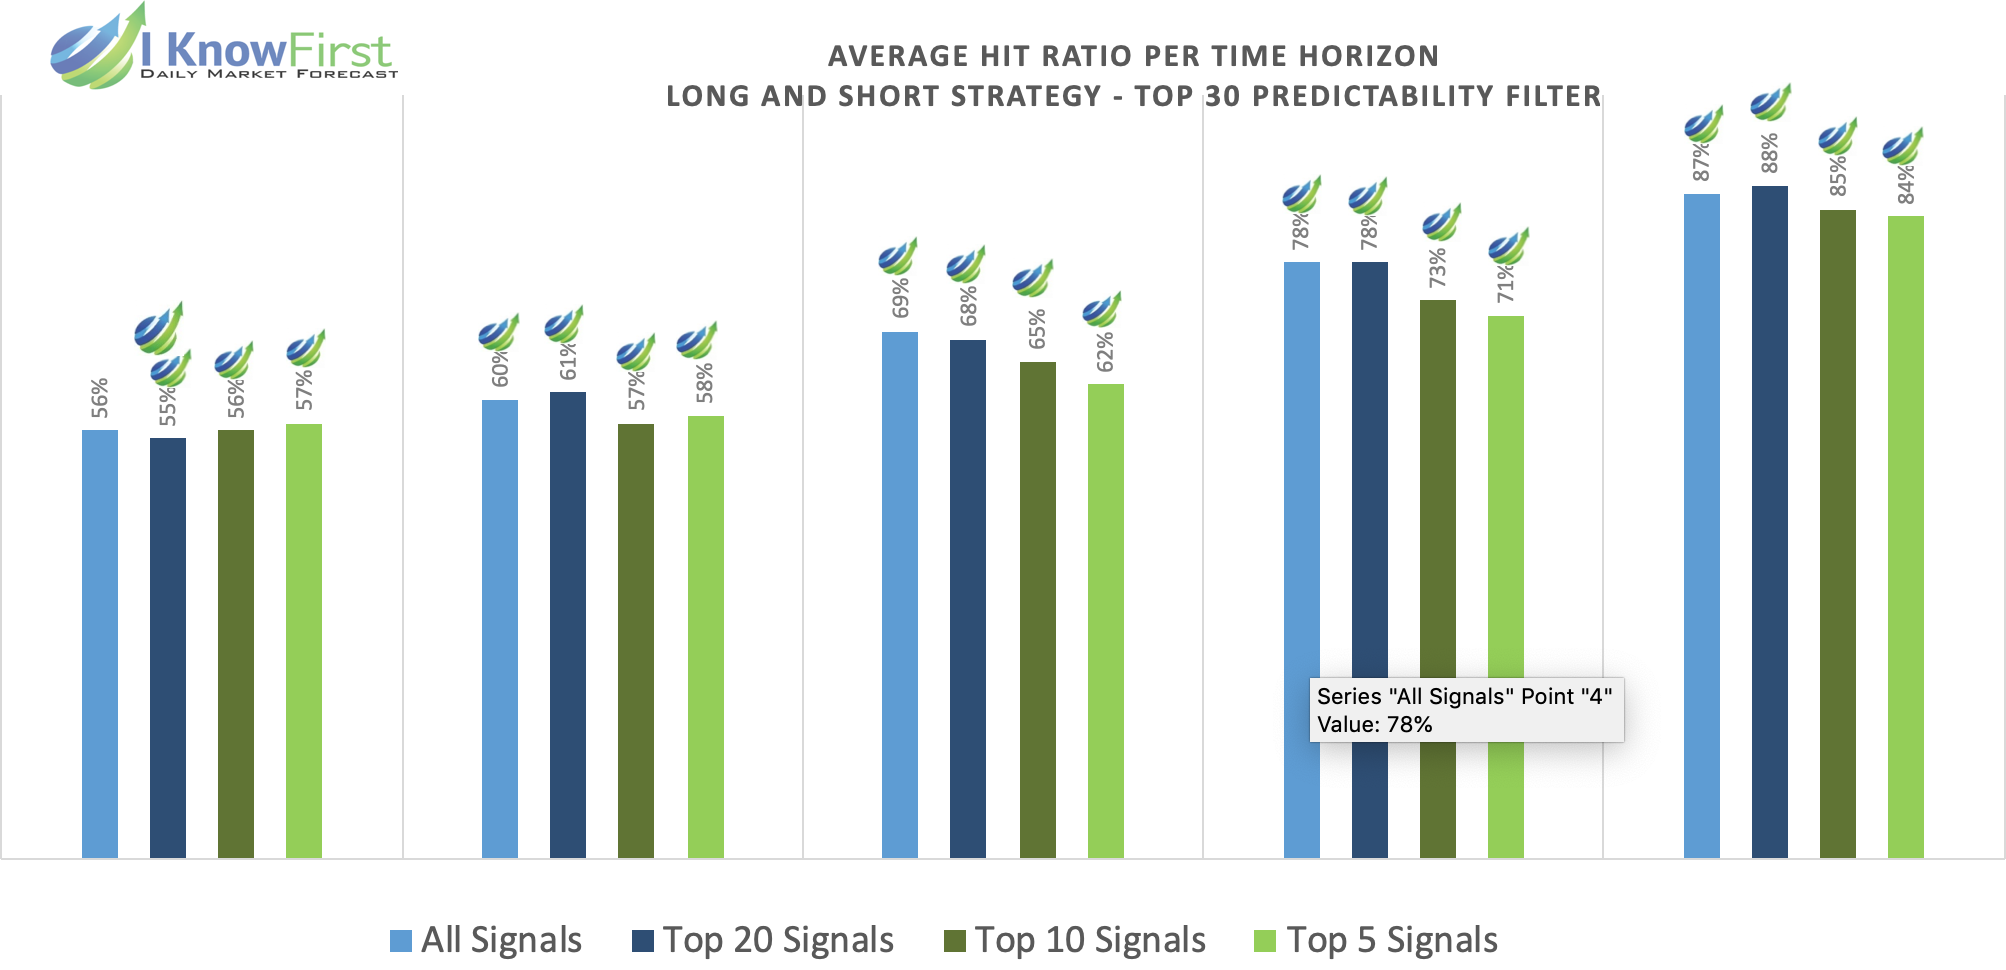

Hit ratios are important for the investor using I Know First’s proprietary AI algorithm. The investor is interested in understanding how an unadulterated portfolio would compare against one that uses the algorithm. If the hit ratio is 50%, it is merely as good as the flip of a fair coin. Not just any number above 50% is good enough for the layman investor. 60% is probably the fair minimum hit ratio that the investor can accept. The Hit Ratios shown above includes the Top 30 predictability assets, the Top 20, Top 10 and Top 5 Signals with horizons of 3 days, 7 days, 14 days, a month and 3 months. If one takes a closer look, the hit ratios improve as the investment horizon expands. It even highlights that the time horizon has more effect on the Hit Ratio than the number of signals used (5, 10 or 20), which had only marginal differences when compared at the same period. The time horizon theory commensurates with the hit ratio, which explains why the Top 20 Signal has a Hit Ratio of 88% for a 3 month time horizon, far better than many forecasts.
Conclusion
In this analysis, we demonstrated the out-performance of our forecasts for the interest rate assets from Interest Rates universe picked by I Know First’s AI Algorithm during the period from 1 January 2019 to 30 June 2019. Based on the presented observations we record significant out-performance of the Top 5 interest rates when our signal indicators are used as an investment criterion. The best results came from the Top 5 interest rate assets filtered by signal yield and had a time horizon of 3 months. The Top 5 signals produced significantly higher returns than any other asset subset on all time horizons spanning from 3 days to 3 months, but was particularly effective at predicting 3 days, 1 month, and 3 month time periods. The hit ratio, especially at the longer time horizons, showed that the algorithm has consistent and substantial success when given the chance to predict Interest Rate assets for 1 or 3 month periods. Thus, an investor who wants to improve the structure of his investments with Interest Rate assets within his portfolio can do so by simultaneously utilizing the I Know First predictability and signal indicators as criteria for identifying the best performing interest rate assets.
Interest Rates Assets Universe Coverage
| Ticker | Full Name of Asset |
| ^TNX | CBOE 10 Year Treasury Yield Index |
| ^TYX | CBOE 30 Year Treasury Yield Index |
| AGG | iShares Core US Aggregate Bond ETF |
| AGZ | iShares Agency Bond ETF |
| BAB | Invesco Taxable Municipal Bond ETF |
| BIV | Vanguard Intermediate-Term Bond Index Fund;ETF |
| BOND | PIMCO Active Bond Exchange-Traded Fund |
| BSV | Vanguard Short-Term Bond Index Fund;ETF |
| BWX | SPDR Bbg Barclays International Treasury Bond ETF |
| CSBGE3.MI | iShares Govt Bond 1-3yr UCITS ETF EUR (Acc) |
| CSBGE7.MI | iShares Govt Bond 3-7yr UCITS ETF EUR (Acc) |
| CWB | SPDR Bloomberg Barclays Convertible Securities ETF |
| EMLC | VanEck Vectors JP Morgan EM Local Currency Bd ETF |
| FRA | BlackRock Floating Rate Income Strategies Fund |
| HYD | VanEck Vectors High-Yield Municipal Index ETF |
| HYG | iShares iBoxx $ High Yield Corporate Bond ETF |
| IBCX.L | iShares Corp Bond Large Cap UCITS ETF EUR (Dist) |
| IEMB.L | iShares J.P. Morgan $ EM Bond UCITS ETF USD (Dist) |
| JNK | SPDR Bloomberg Barclays High Yield Bond ETF |
| LQD | iShares iBoxx $ Inv Grade Corporate Bond ETF |
| MORL | ETRACS Monthly Pay 2xLeveraged Mortgage REIT ETN |
| MTB.PA | MTB Group of Funds – MTB Pennsylvania Tax-Free Money Market Fund |
| NEA | Nuveen AMT-Free Quality Municipal Income Fund |
| PCY | Invesco Emerging Markets Sovereign Debt ETF |
| PGX | Invesco Preferred ETF |
| PZA | Invesco National AMT-Free Municipal Bond ETF |
| SJNK | SPDR Bbg Barclays Short Term High Yield Bond ETF |
| STIP | iShares 0-5 Year TIPS Bond ETF |
| TBF | ProShares Short 20+ Yr Treasury |
| TBT | ProShares UltraShort 20+ Year Treasury |
| TIP | iShares TIPS Bond ETF |
| US 10Y | US10Y Bond |
| US 10YTIP | 10-Year Treasury Inflation-Indexed Security, Constant Maturity |
| US 20YTIP | 20-Year Treasury Inflation-Indexed Security, Constant Maturity |
| US 2Y | US2Y Bond |
| US 30Y | US30Y Bond |
| US 30YTIP | 30-Year Treasury Inflation-Indexed Security, Constant Maturity |
| US 3M | US3M Bond |
| US 3Y | US3Y Bond |
| US 5Y | US5Y Bond |
| US 5YTIP | 5-Year Treasury Inflation-Indexed Security, Constant Maturity |
| VCIT | Vanguard Intermediate-Term Corp Bond Idx Fund;ETF |
| VCSH | Vanguard Short-Term Corporate Bond Idx Fd;ETF |