

I Know First Live Forecast Evaluation Report For Japanese Stock Market – Continuously Beating Nikkei 225 Index And Japan Stock Market Benchmarks


Executive Summary
In this live forecast evaluation report we will examine the performance of the forecasts generated by the I Know First AI Algorithm for the Japanese stock market and sent to our customers on a daily basis. Our analysis covers time period from December 26, 2017 – August 24, 2018. We will start with an introduction to our stock picking and benchmarking methods and then apply it to the stock universe of the Nikkei 225 index as well as all of the stocks covered by us in the “Japan Stocks” Package.
About the I Know First Algorithm


The I Know First self-learning algorithm analyzes, models, and predicts the stock market. The algorithm is based on Artificial Intelligence (AI) and Machine Learning (ML), and incorporates elements of Artificial Neural Networks and Genetic Algorithms.
The system outputs the predicted trend as a number, positive or negative, along with a wave chart that predicts how the waves will overlap the trend. This helps the trader to decide which direction to trade, at what point to enter the trade, and when to exit. Since the model is 100% empirical, the results are based only on factual data, thereby avoiding any biases or emotions that may accompany human derived assumptions. The human factor is only involved in building the mathematical framework and providing the initial set of inputs and outputs to the system. The algorithm produces a forecast with a signal and a predictability indicator. The signal is the number in the middle of the box. The predictability is the number at the bottom of the box. At the top, a specific asset is identified. This format is consistent across all predictions.
Our algorithm provides two independent indicators for each asset – Signal and Predictability.
The Signal is the predicted strength and direction of movement of the asset. Measured from -inf to +inf.
The predictability indicates our confidence in that result. It is a Pearson correlation coefficient between past algorithmic performance and actual market movement. Measured from -1 to 1.
You can find the detailed description of our heatmap here.
The stock picking method
The method in this evaluation is as follows:
We take the top X most predictable assets, and from them we pick the top Y highest signals.
By doing so we focus on the most predictable assets on the one hand, while capturing the ones with the highest signal on the other.
For example, a top 30 predictability filter with a top 10 signal filter means that on each day we take only the 30 most predictable assets, and then we pick from them the top 10 assets with the highest absolute signals.
We use absolute signals since these strategies are long and short ones. If the signal is positive, then we buy and, if negative, we short.
The performance evaluation method
We perform evaluations on the individual forecast level. It means that we calculate what would be the return of each forecast we have issued for each horizon in the testing period. Then, we take the average of those results by strategy and forecast horizon.
For example, to evaluate the performance of our 1-month forecasts, we calculate the return of each trade by using this formula:

This simulates a client purchasing the asset based on our prediction and selling it exactly 1 month in the future.
We iterate this calculation for all trading days in the analyzed period and average the results.
Note that this evaluation does not take a set portfolio and follow it. This is a different evaluation method at the individual forecast level.
The benchmarking method
The theory behind our benchmarking method is the “Null hypothesis“, meaning buying every stock in the particular asset universe regardless of our I Know First indicators.
In comparison, only when our signals are of high signal strength and high predictability, then the particular stocks should be bought (or shorted).
The ratio of our signals trading results to benchmark results indicates the quality of the system and our indicators.
Example: A benchmark for the 3d horizon means buy on each day and sell exactly 3 business days afterwards. We then average the results to get the benchmark. This is in order to get an apples to apples comparison.
Evaluating the predictability indicator
Following the methodology described in the previous sections we start our analysis with computing the performance of the algorithm’s long and short signals for time horizons ranging from 3 days to 3 months without considering the signal indicator. Therefore, we applied filtering by the predictability indicator for 5 different levels to investigate its sole marginal effect in terms of return when different filters are applied. Afterwards, we calculated the returns for the same time horizons of the two benchmarks using the Nikkei 225 stock universe and our entire Japanese Stock Market asset universe[1] and compared them to the performance of the filtered sets of assets. Our findings are summarized in the tables below:
Figure 5 -1 (A) Nikkei 225 – Predictability Effect On Return
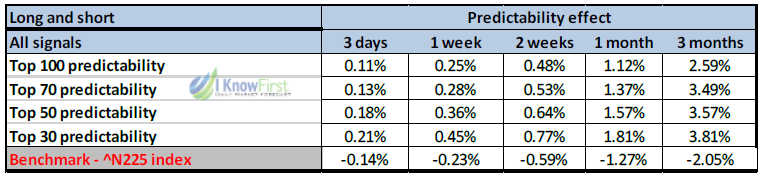

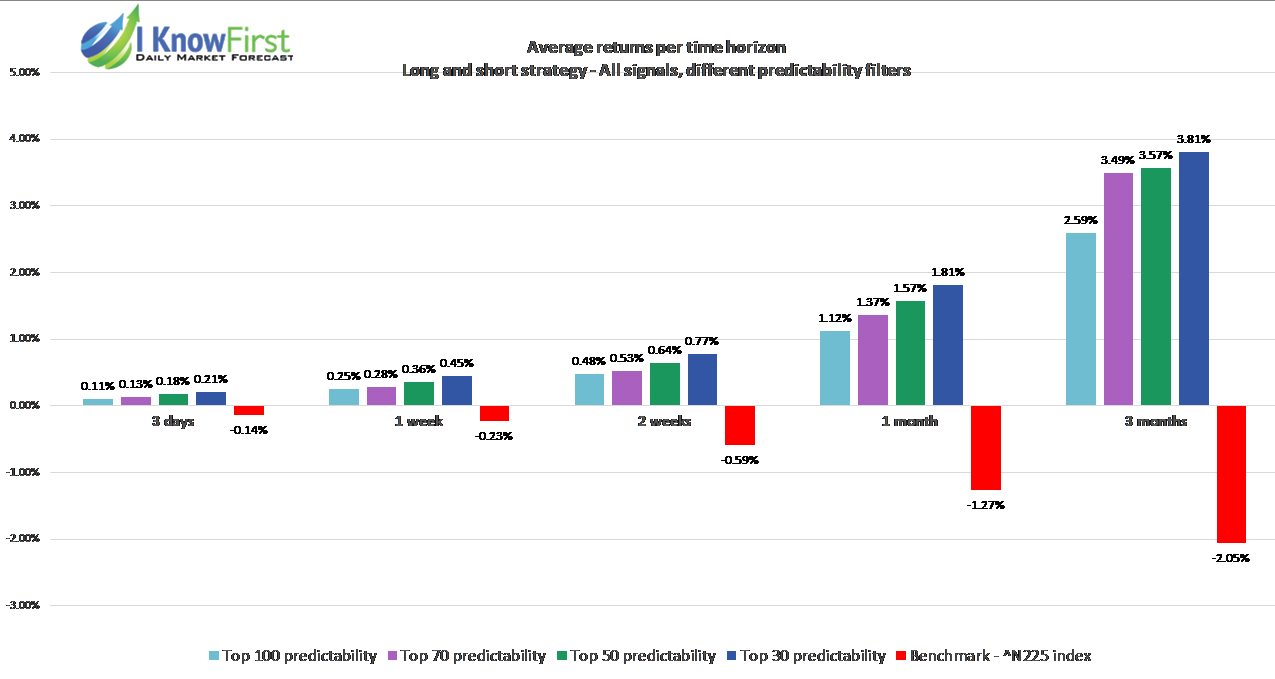

Figure 5 -1 (B) Japan Stock Market – Predictability Effect On Return
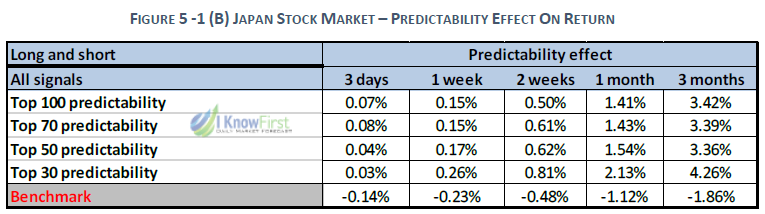

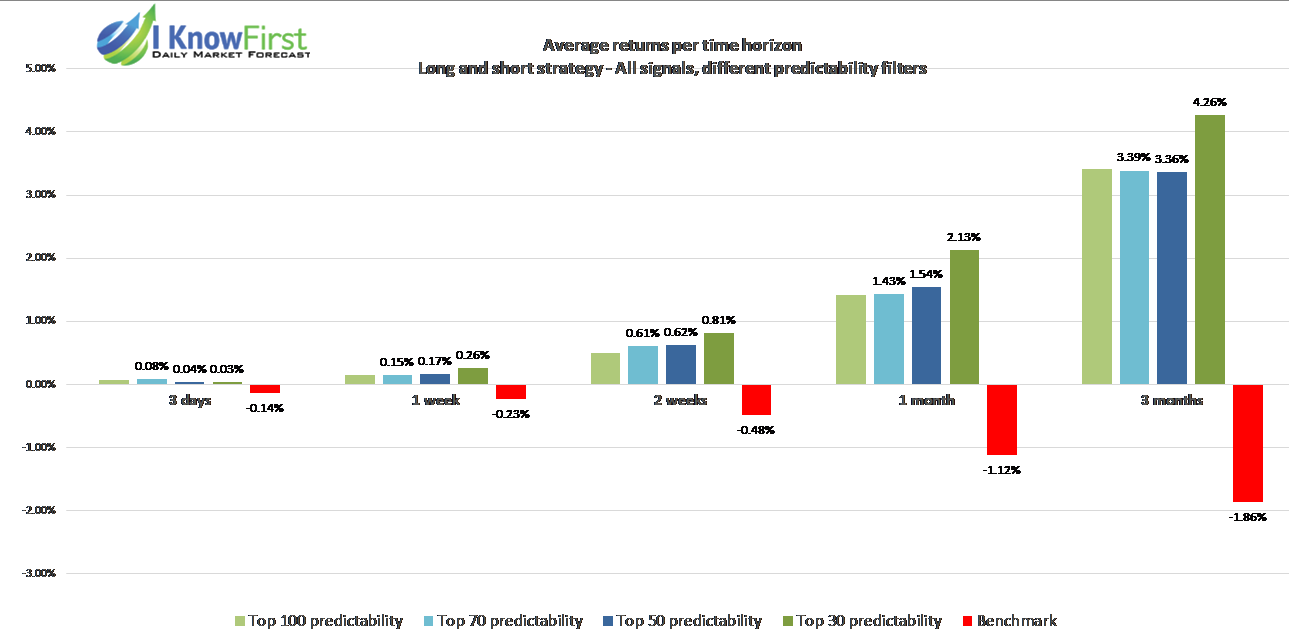

From the above charts one can observe that the marginal predictability effect increases with the narrowing of the asset subsets from the Top 100 assets to the Top 30 assets filtered by predictability. We observed this effect for all considered time horizons and the maximum performance was achieved at 3 months horizon. In comparison with the benchmarks based on all assets from each of the considered assets’ universes, we can see that just by applying the predictability indicator as an investment criterion without consideration of the signal strength already yields positive return and outperforms the benchmarks itself.
Evaluating the Signal indicator
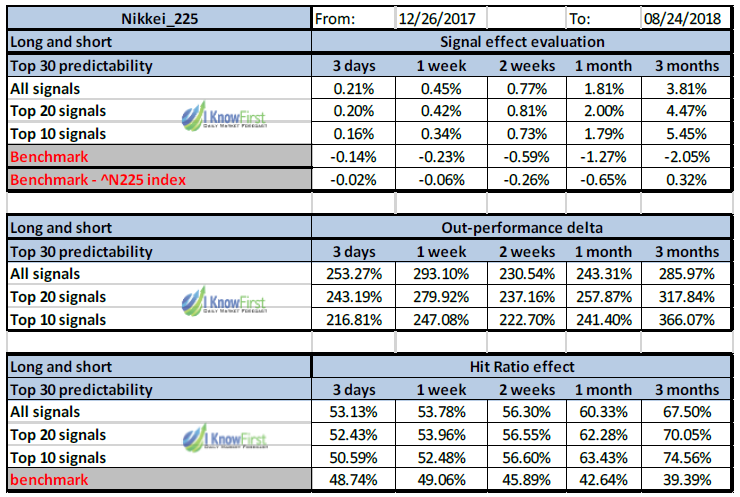
In this section we will demonstrate how adding the signal indicator to our stock picking method improves the above performance even further. It is also important to measure the outperformance relative to the benchmark and for that we will apply the formula:
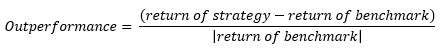

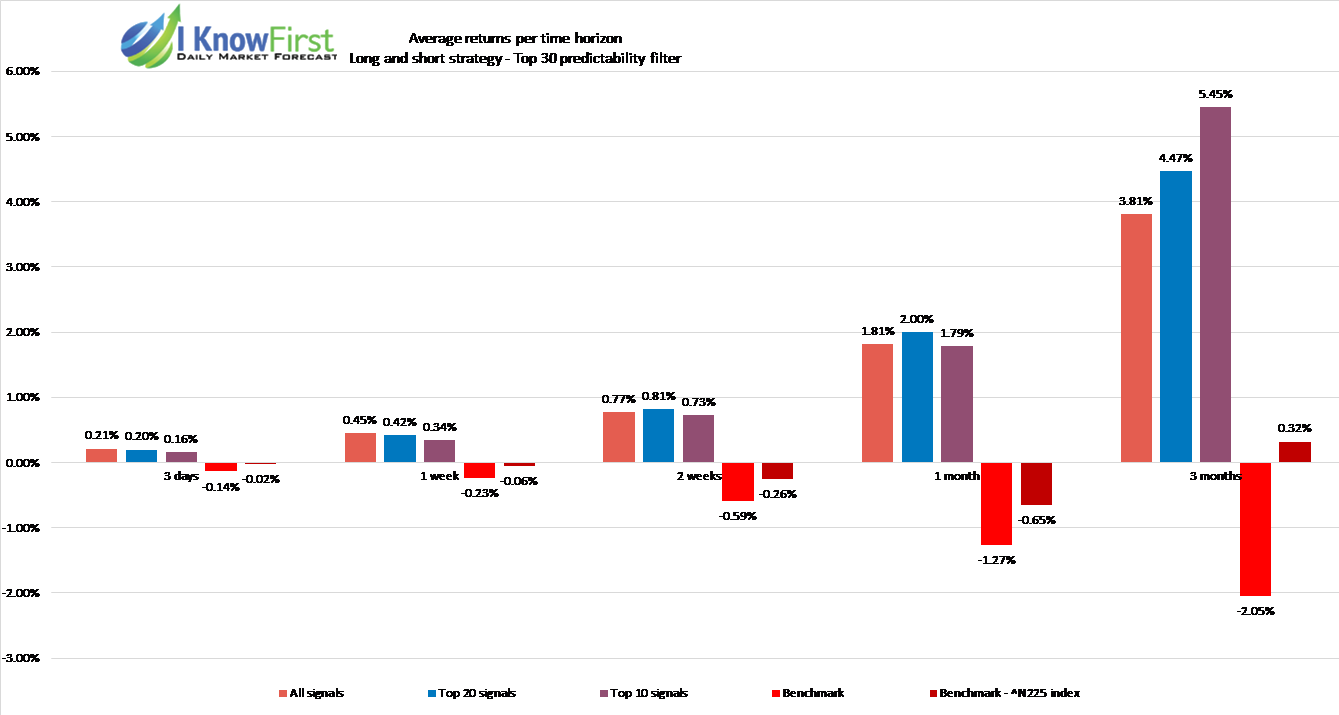
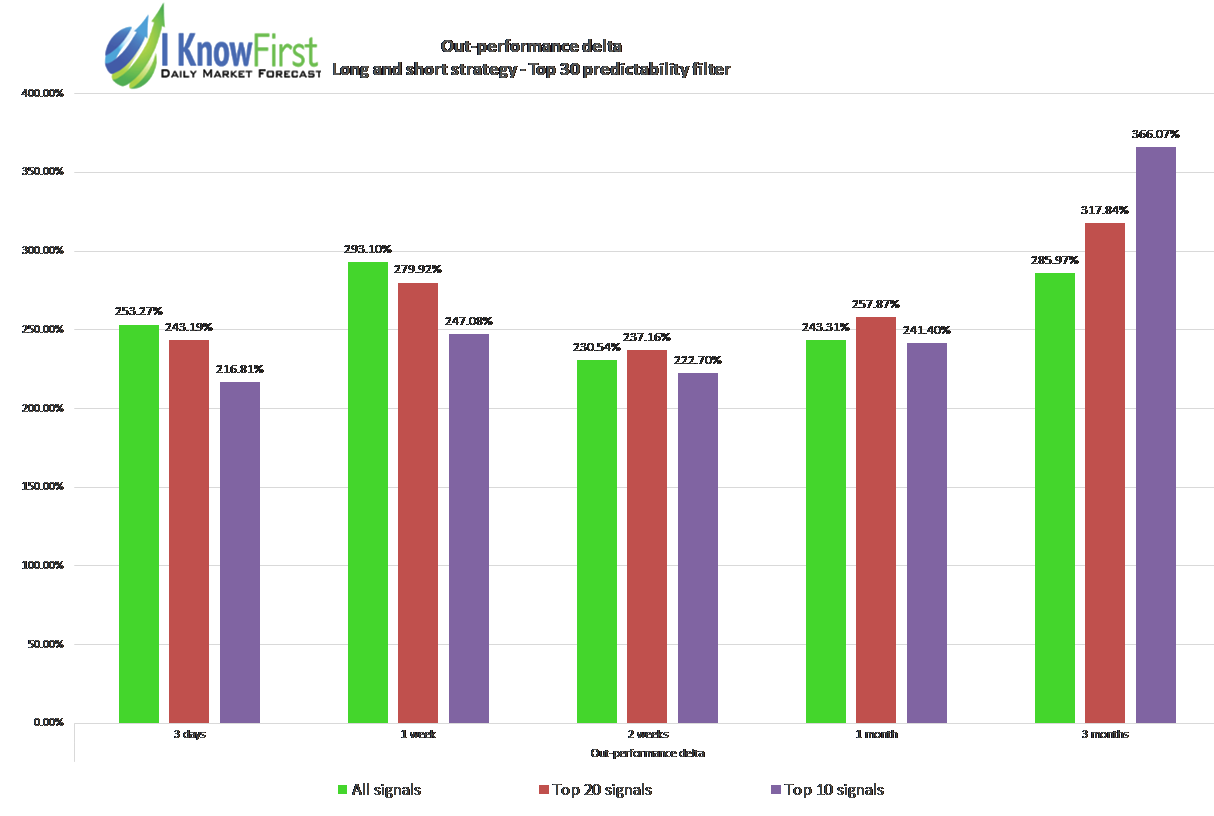
Therefore, we applied filtering by signal strength to the Top 30 assets filtered previously by predictability. The results of the testing showed that there is a significant positive marginal effect on the assets return, especially in the case of the 3 months investment horizon. We present our findings in the following sets of tables and charts (Figure 5-2(A) and Figure 5-2(B)).
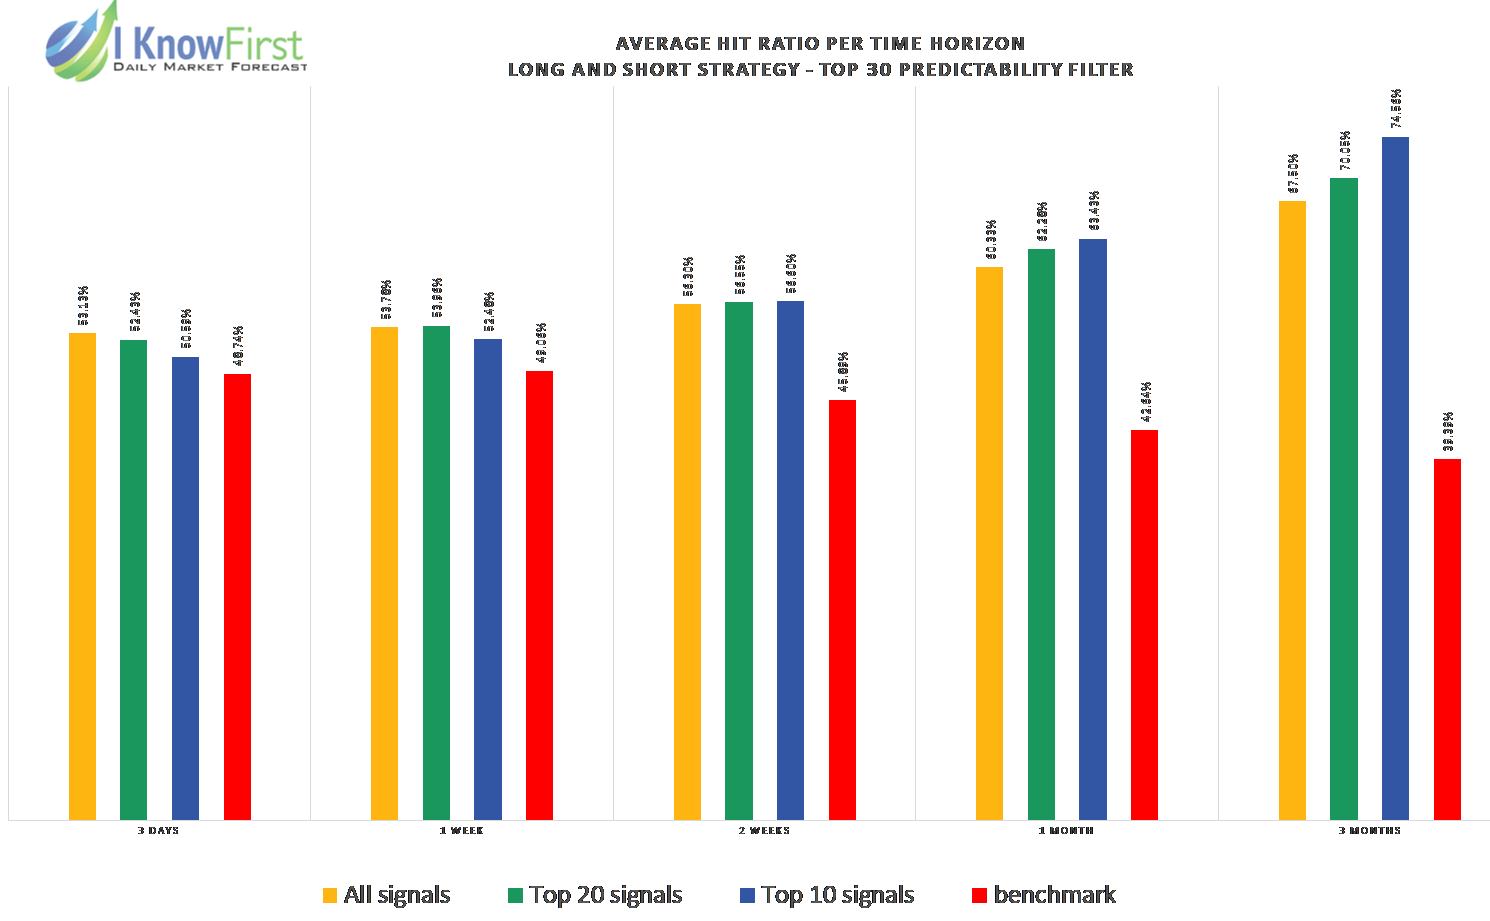
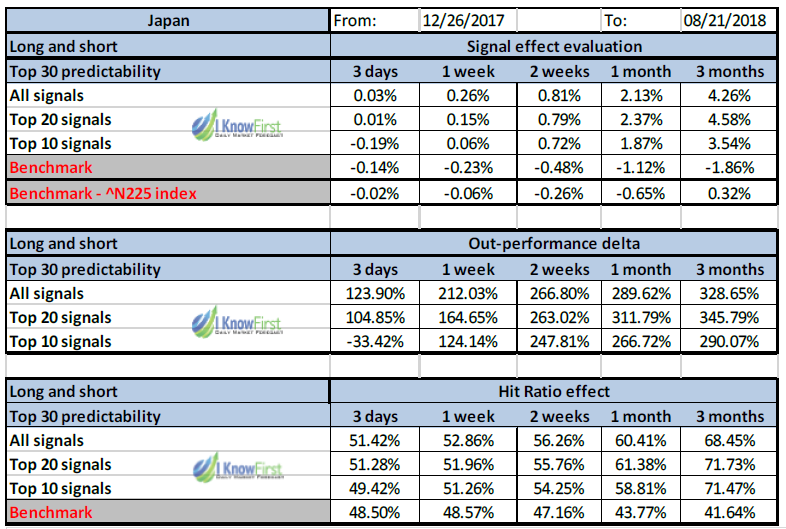
Figures 5-2 (A) Nikkei 225 – Key Performance Indicators Summary

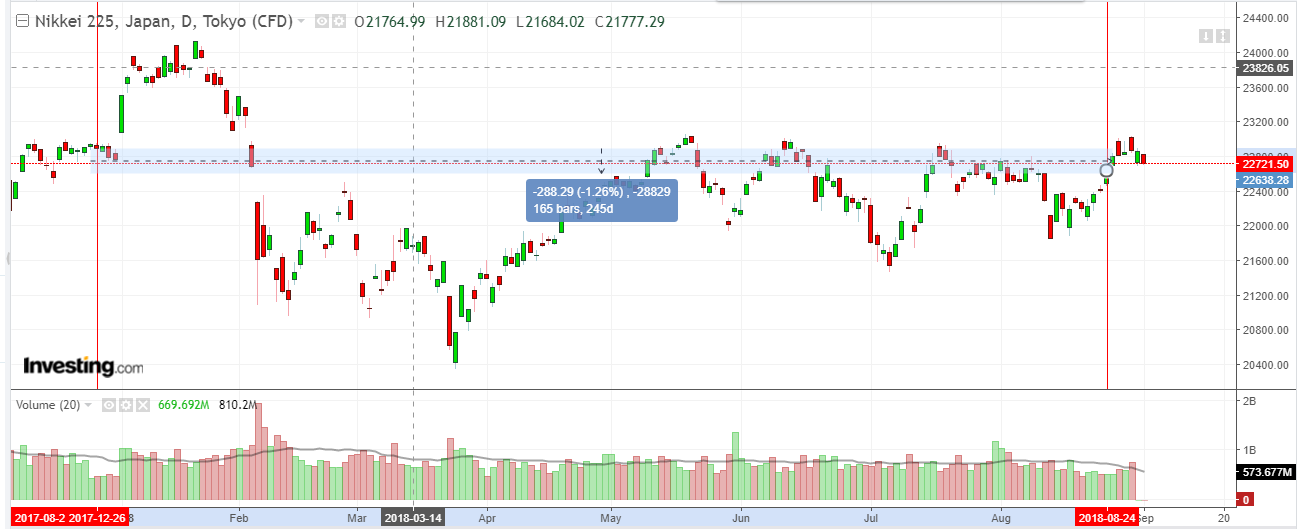
In this chart you can see how the Nikkei 225 index performed during this same time period.

From the above set of charts, we can clearly see that if we apply signal strength filtering to the Nikkei 225 stocks universe, the subsets of Top 20 and Top 10 stocks will start to produce greater returns than the benchmarks and the original subset filtered only by predictability starting from 2-weeks investment horizon. As soon as we start to consider 1-month and 3-months’ time horizons, we see that the performance of the Top 20 set is higher on 1-month horizon than of the Top 10 set by 0.21%. However, as we move to analysis of 3-months’ time horizon, we observe that the Top 10 set produces significantly greater return than Top 20 – 5.45% versus 4.47%. At the same time, the Top 20 and Top 10 sets outperform against the benchmarks on 3-month by 317.84% and 366.07%, respectively. Finally, the hit ratio follows the same pattern and we observe its peak values for both Top 20 and Top 10 sets on 3-month time horizon – 70.05% and 74.56% respectively.
Figure 5-2 (B) Japan Stock Market Universe – Key Performance Indicators Summary

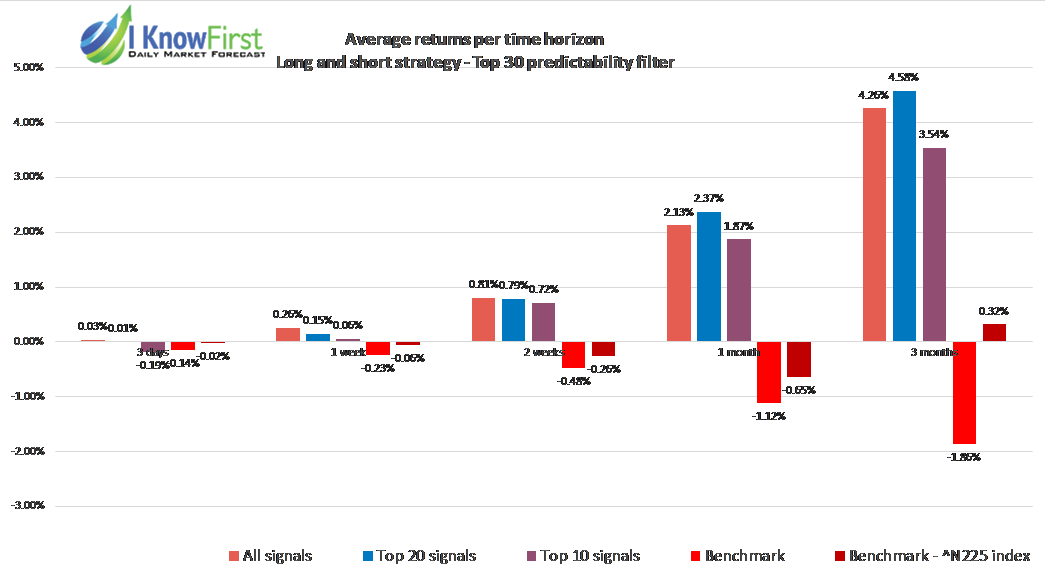
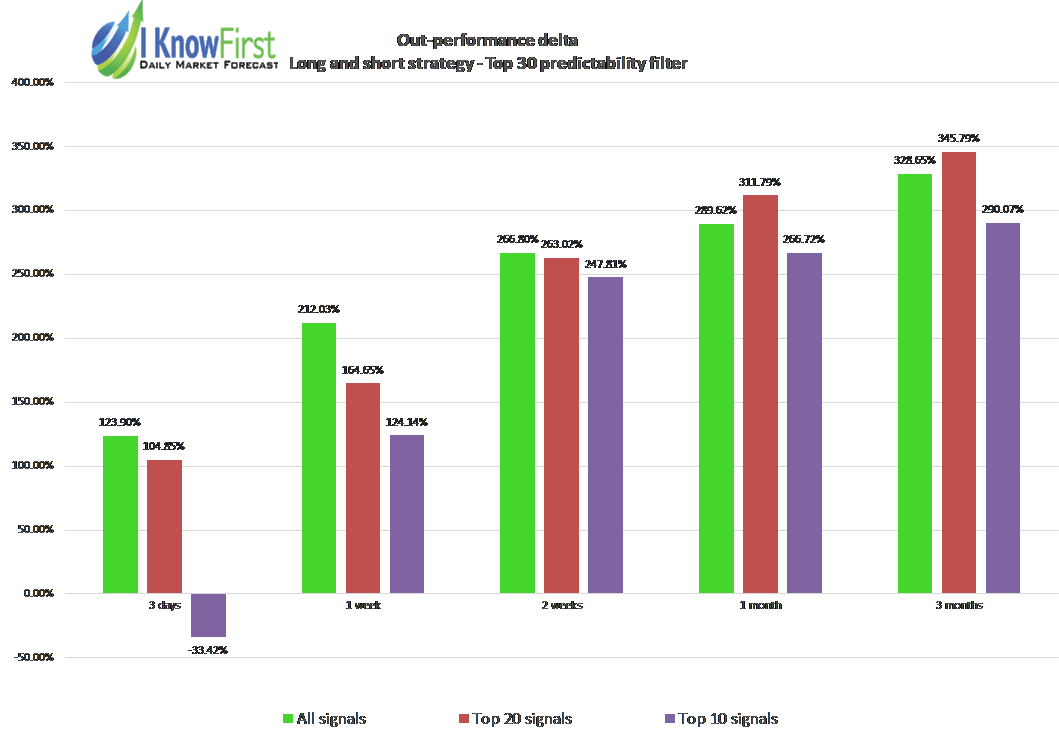
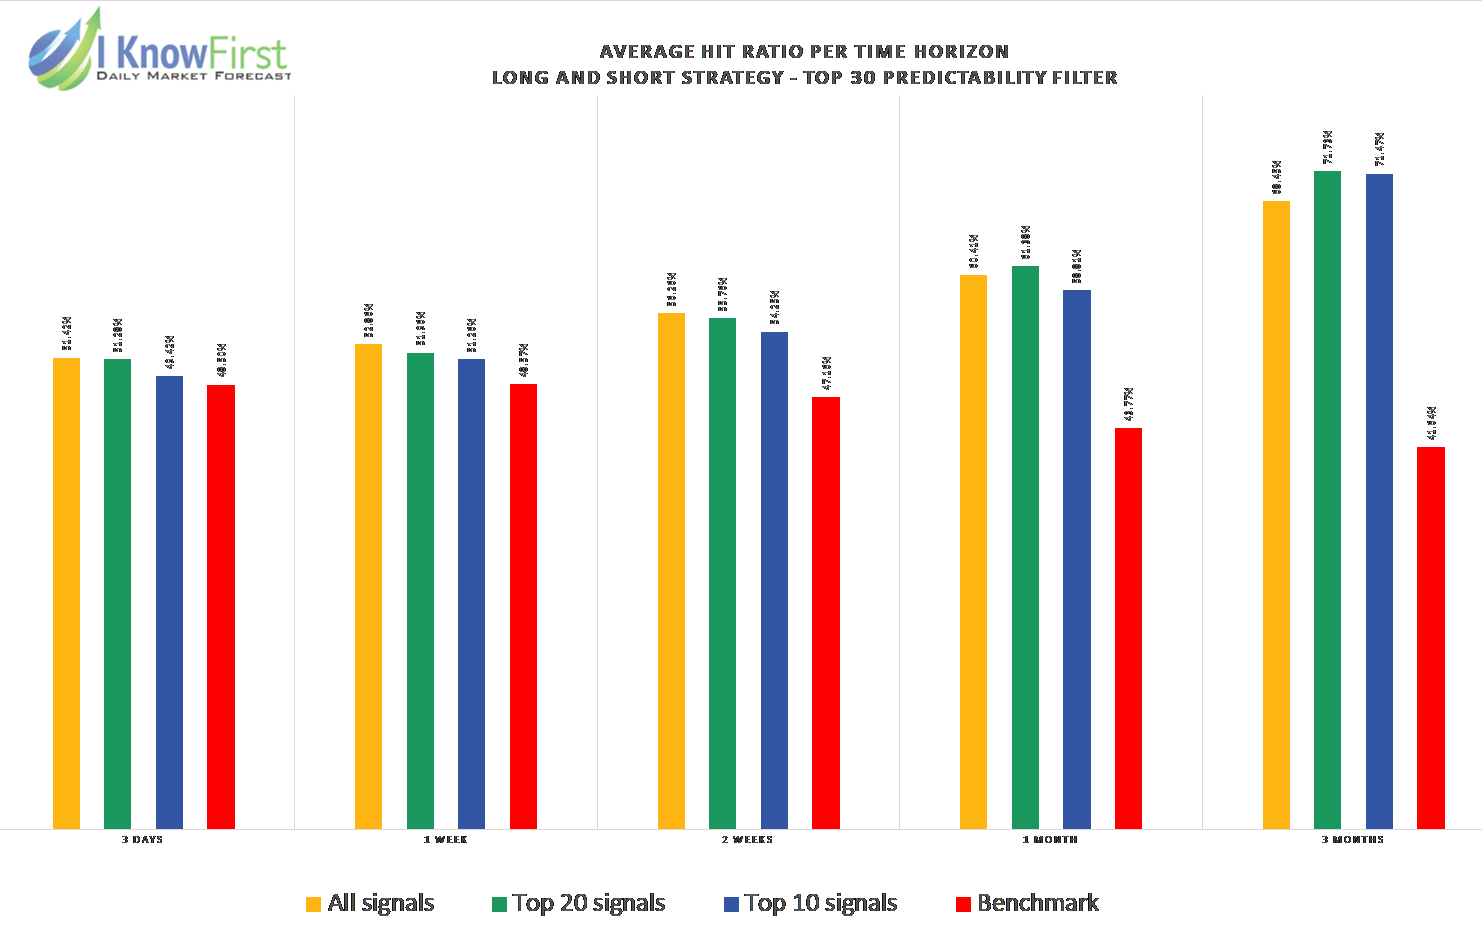
From the above set of charts, we can clearly see that if we apply signal strength filtering to the Japanese Stock Market universe, the subsets of Top 20 and Top 10 stocks will produce greater returns than the benchmarks and the original subset filtered only by predictability starting from the 1-month investment horizon. In comparison to the Nikkei 225 universe results, we observe that Top 20 set produces even greater return than Top 10 set on both time horizons. Moreover, the differences in the returns are larger than in the previous case and the outperformance values for Top 20 and Top 10 sets against the benchmarks are 345.79% and 290.07% respectively. Finally, the hit ratio follows a slightly different pattern comparing to the previous case and we observe that the peak values for both Top 20 and Top 10 sets on 3-month time horizon are approximately the same – 71.73% and 71.47% respectively.
Summary
In this analysis we demonstrated the out-performance of our forecasts for the Japanese Stocks picked by I Know First’s AI Algorithm from the Nikkei 225 index universe and the Japanese market in general. Based on the presented findings we record significant outperformance of the Top 30 stocks filtered by predictability for all time horizons for both asset universes even without filtering by signal strength.
Applying our predictability indicator as an investment criterion coupled with filtering by our signal strength results in even greater outperformance over the benchmarks comprised of stocks from the Nikkei 225 index and the Japanese stock market in general. The Top 10 stocks from the Nikkei 225 index filtered by predictability and signal yield significantly higher returns than other asset subsets on the 3-month time horizon. In case of the Japanese stock market in general, the Top 20 stocks filtered by predictability and signal yield higher returns than any other subset on both the 1-month and 3-month time horizons. Therefore, an investor can greatly improve the quality of his investment decisions by the application of the I Know First predictability indicator coupled with the I Know First signal indicator as criteria for picking stocks.
[1] Stocks covered by I Know First in Japan Stocks Package
© 2018 I Know First Ltd. All Rights Reserved