

An Overview of How To Use I Know First’s AI Forecasts for ETF Trading
In the following, we give an overview of the construction and performance of ETF Portfolios constructed using I Know First’s Algorithmic Forecasts for the Sector ETFs. We present the construction and performance of:
- Portfolios which directly use the algorithmic signals generated to select the sector ETFs to invest in and to rebalance the portfolio
- Portfolios which use sector-level predictions computed by aggregating our forecasting algorithm’s daily forecasts for individual S&P 500 stocks
- Portfolios which combine the algorithmic forecasts with a benchmark to create long-only strategies which allow investors to target desired alpha and beta statistics
We show that these portfolios register very good performance statistics over the analyzed time-horizon outperforming the benchmark.
I Know First Overview
I Know First is an Israeli Fintech company that brings artificial intelligence to the financial world by providing daily investment forecasts based on an advanced self-learning algorithm. This algorithm generates daily investment predictions for a universe of over 7,000 assets which results in a daily ranking of investment opportunities. These can easily be integrated into the investment selection processes and, combined with the appropriate strategy, be translated into portfolios with outstanding statistics for all types of investors. Here we focus on ways of constructing portfolios of sector ETFs which contain S&P 500 stocks grouped by GICS sector classification and facilitate passive investment in specific sectors of the US economy.
ETF Portfolios Based on Direct Signals
ETF Portfolio of Top Sector(s)
First, we present the performance between August 2015 and September 2017 of constructing ETF portfolios by investing long and short in the strongest two sector ETFs as selected by our algorithm. The results of this trading strategy, including the effects of spreads and commissions, can be seen in the table below (click on the table to enlarge).
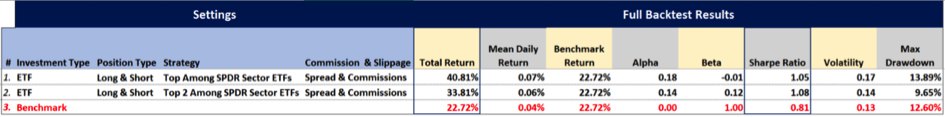
The first row in the table presents the statistics of investing long and short only in the ETF with the strongest signal, while the second row of investing in the top two ETFs.
As can be seen above the two ETF portfolios register an outstanding performance:
- Total returns reaching 40% and 33% versus the benchmark’s return of 22% in the 2-year time period
- Sharpe ratios above 1.00 versus the benchmark’s 0.81
- Betas of -0.01 and 0.12
- Alphas above 14%
The chart for the two strategies can be seen below.
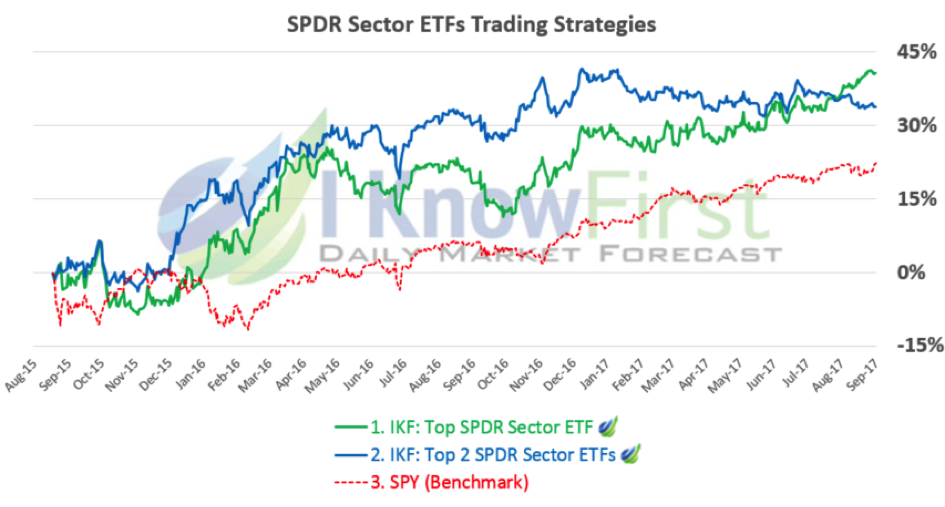
The ETF portfolios result in steady and consistent growth over the benchmark even in this period of great market growth.
ETF Portfolio of All Sectors
In a second step, we combine these results with a baseline equally invested in all sectors to construct a long-only ETF portfolio which follows the market but overweights/underweights sectors according to our algorithmic predictions. This is implemented by initially investing equally in each SPDR sector ETF and then adding/subtracting weight to those sectors for which our algorithmic signals are positive/negative. This results in strategies that are long only as we set the minimum weight for any sector to be zero, and which can trade off proximity to the overall market for alpha by moving weight from the baseline to the algorithmic signals. The statistics of these strategies are displayed in the table below.
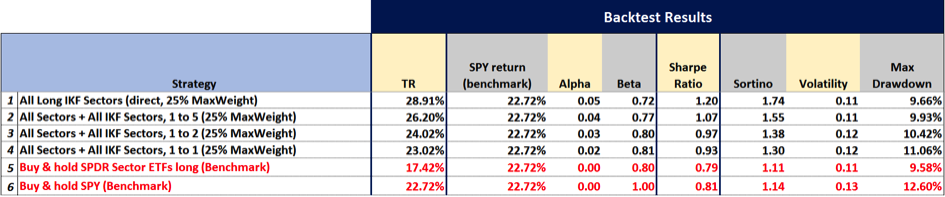
The table can be read from the bottom up as going from investing equally long in all SPDR sector ETFs without using the algorithmic signals (benchmark, row 5), gradually adding more and more weight to I Know First’s predictions resulting in combinations of the benchmark with the algorithmic forecasts (rows 2-4), and culminating in the top row in an ETF portfolio in which only the algorithmic signals are used (row 1).
As can be seen in the chart as we move from row 5 up and thus go from an equally weighted ETF portfolio to a more algorithmically weighted ETF portfolio:
- Total Returns increase from 17% to 28% with all I Know First portfolios outperforming the SPY’s 22% return (row 6)
- Annualized Alpha increases from 0% to 5%
- Beta decreases from 1.00 to 0.72
- Sharpe Ratio increases from 0.79 to 1.20
- Volatility remains stable at around 11%-12%.
This approach allows investors to fine tune their ETF portfolio to the statistics and proximity to the benchmark they desire by allocating more or less weight to the algorithmic signals with the best performing strategy being the one that only invests in the ETFs selected by the algorithm.
The equity lines for the various ETF portfolios are displayed below.
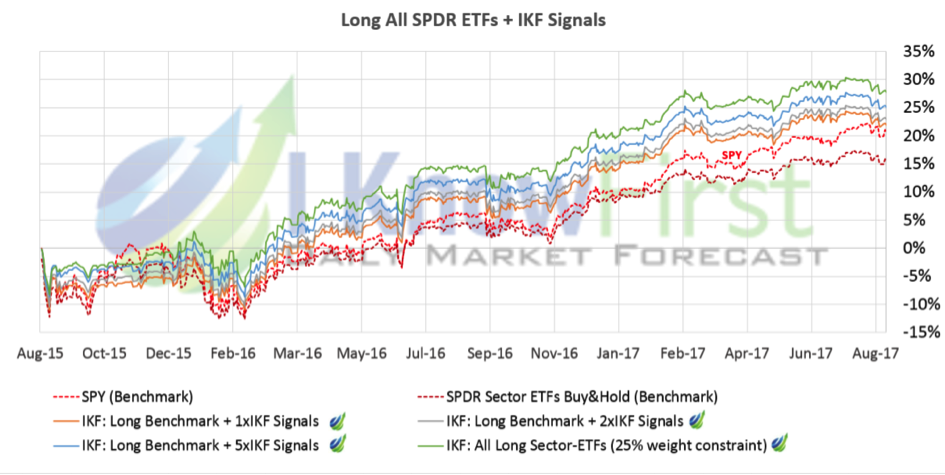
The chart displays the same pattern described above and shows that the portfolios give rise to smooth, consistently growing equity lines.
Forecast Aggregation into Macro-Level Predictions
Another approach to deriving sector level-predictions is, instead of using the direct predictions for the ETFs, to aggregate the daily forecasts generated by our algorithm for individual S&P 500 stocks grouped by sector into algorithmic sector-level predictions for each of the 11 GICS sectors thus creating a daily aggregated sector direction which we can then use to trade the corresponding sector ETFs. This bottom-up approach allows us to build aggregated predictions for any category of stocks which can be customized to the needs of clients.
Forecast Aggregation into Sector-Level Predictions
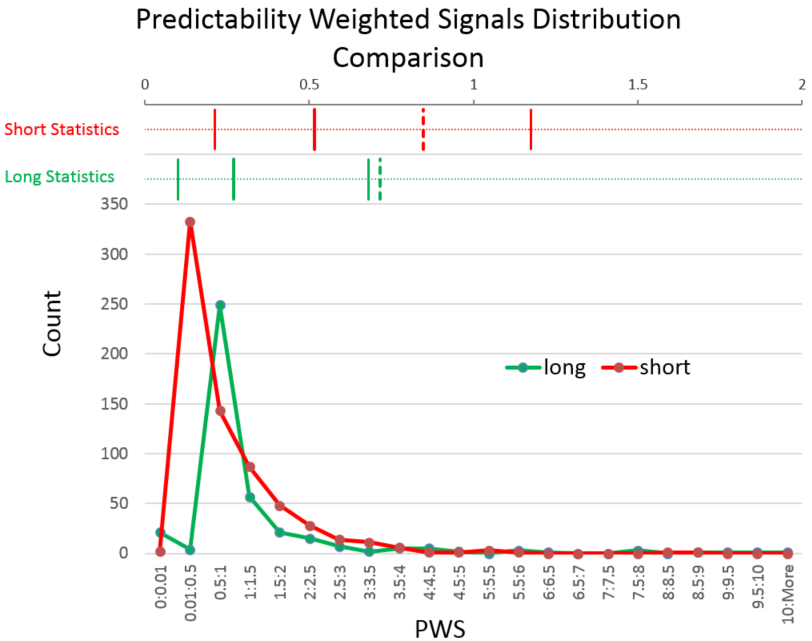 The concept behind the aggregation is to combine the information from individual stocks within each sector to decide whether we are bullish, bearish, or neutral for each sector. The direction is determined by comparing the distributions of the long and short predictions for the stocks within the sector and deciding using standard distribution statistics such as mean, median, and quantiles which distribution is “larger” in the sense that the predictions in this direction are stronger. Note that instead of comparing the distributions of the signals we compare the predictability weighted signals (PWS) thus incorporating the predictability indicator into the direction selection. Finally, we require certain minimum requirements to be fulfilled such as that over 60% of the PWSs to be in the direction of the sector we picked: if these are not met we mark the sector as neutral. This process results in a daily direction decision for each sector which can then be used to construct portfolios in which the ETFs for the respective sectors are held in the direction of the aggregated prediction.
Performance of Portfolios Built using the Aggregated Sector Predictions
The performance of portfolios built using the predictions derived through this method for the period 08/18/2015 – 01/09/2017 including the effect of bid-ask spreads and commissions (0.35 cents per share) are summarized in the following table (click on the table to enlarge). Rows 1 through 4 present the statistics of the I Know First Portfolios while rows 5 and 6 those of the benchmarks: the SPDR SPY ETF (market cap weighted S&P 500 stocks ETF) and the equally weighted long sector ETFs.
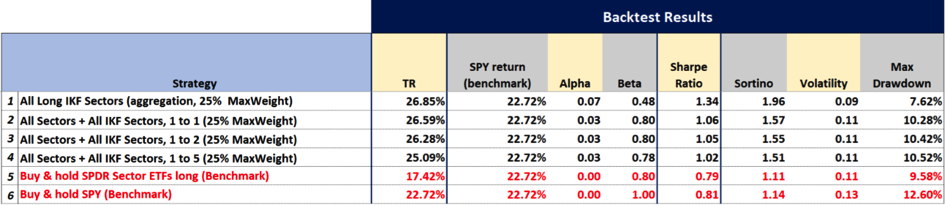
The table can again be read from the bottom up as going from investing equally long in all SPDR sector ETFs without using the aggregated algorithmic signals (benchmark, row 5-6), gradually shifting weight to I Know First’s sector-level predictions which results in a combination of the benchmark and the algorithmic forecasts (rows 2-4), and culminating in the top row in an ETF portfolio in which only the aggregated signals are used (rows 1).
As can be seen in the chart as we move from row 7 up and thus go from an equally weighted ETF portfolio to a more algorithmically weighted ETF portfolio:
- Total Returns increase from 17% to 26%
- Annualized Alpha increases from 0% to 7%
- Beta decreases from 1.00 to 0.48
- Sharpe Ratio increases from 0.79 to 1.34
- Volatility remains stable at around 11%-12% for most strategies and decreases to 9% for the portfolio solely based on the aggregated predictions
The equity lines for the various ETF portfolios are displayed below.
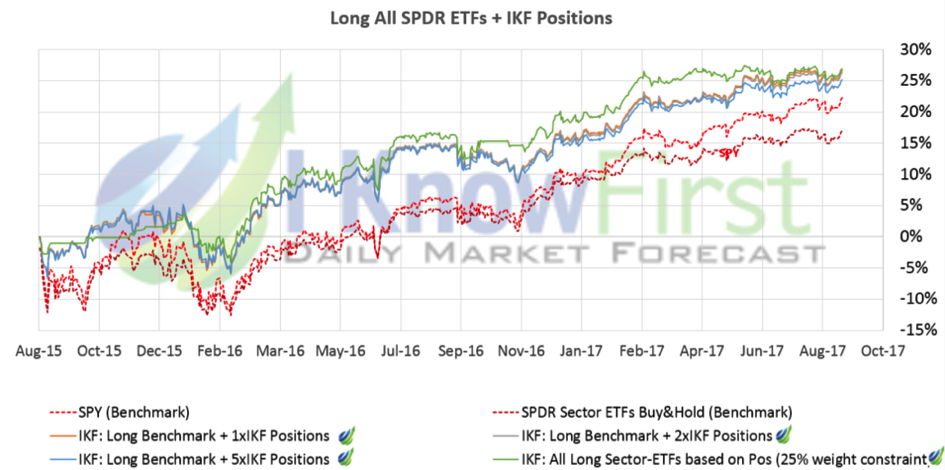
The chart displays a symilar pattern to the one described above and shows that the algorithmic portfolios give rise to smooth, consistently growing equity lines.
Conclusion
In closing, we presented a set of analyses on how to construct an ETF portfolio using the signals generated by our self-learning predictive AI algorithm for sector ETFs and S&P 500 stocks.
First, we showed the results of investing using the direct ETF signals as generated by our predictive algorithm which resulted in portfolios with total returns reaching 40% in a 2-year time horizon versus the benchmark’s 22%, Sharpe ratios reaching 1.20 versus the benchmark’s 0.81, and Alpha as high as 18%.
We also presented ways in which our stock level forecasts can be aggregated to create macro level predictions and evaluated a set of such predictions for the S&P 500 GICS sectors. The portfolios built using these predictions in the 2-year period analyzed resulted in returns reaching 26% versus the benchmark’s 22%, Sharpe Ratios up to 1.3, Alpha up to 5%, and Beta as low as 0.48.
Moreover, we showed how both of the algorithmic (direct signal based and signal aggregation based) ETF portfolios can be combined with the benchmark to construct long only strategies which investors can fine tune to target specific levels of Alpha and Beta statistics.