
Aggressive Stocks Amid Coronavirus Market in 2020
Executive Summary
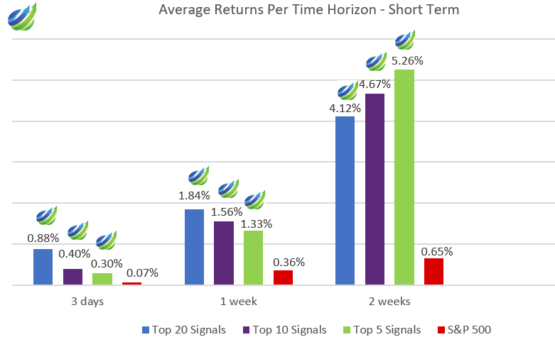
The purpose of this report is to present the results of the live forecast performance evaluation for I Know First AI Algorithm, specifically for the Aggressive stocks. The following results were observed when signal and predictability filters were applied to pick the best-performing stocks out of the most predictable ones. The period under evaluation is from 20th December 2019 to 8th November 2020. The corresponding returns distribution of stock filters for the Aggressive stocks are shown below:


The Aggressive Stocks Package Highlights:
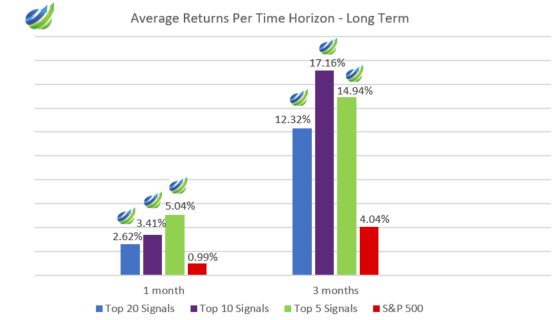
- The highest average return in the longest horizon of time – 3 months: for the Top 20 signals – 12.32%, for the Top 10 signals – 17.16%, for the Top 5 signals – 14.94%.
- S&P 500 price target implying a 12% rally in 2021.
- 17,16 % – the highest average return for an investor is the Top 10 Signals with a period of 3 months.
The above results based on forecasts’ evaluation over the specific time period using a consecutive filtering approach. Consecutive filtering includes predictability, then signal, to give an overview of the forecasting capabilities of the algorithm for the specific stock universe.
About the I Know First Algorithm
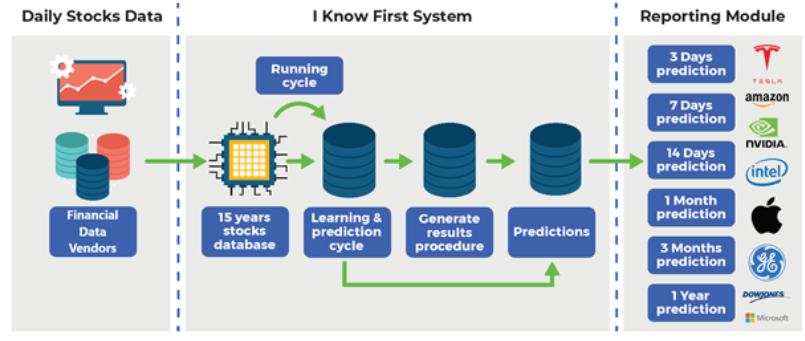

The I Know First self-learning algorithm analyzes, models, and predicts the stock market. The algorithm is based on Artificial Intelligence (AI) and Machine Learning (ML) and incorporates elements of Artificial Neural Networks and Genetic Algorithms.
The system outputs the predicted trend as a number, positive or negative, along with a wave chart that predicts how the waves will overlap the trend. This helps the trader to decide which direction to trade, at what point to enter the trade, and when to exit. Since the model is 100% empirical, the results are based only on factual data. Thereby results in avoiding any biases or emotions that may accompany human-derived assumptions.
The human factor is only involved in building the mathematical framework. The algorithm produces a forecast with a signal and a predictability indicator. The signal is the number in the middle of the box. The predictability is the number at the bottom of the box. At the top, a specific asset is identified. This format is consistent across all predictions.
Our algorithm provides two independent indicators for each asset – Signal and Predictability.
The Signal is the predicted strength and direction of the movement of the asset. Measured from -inf to +inf.
The predictability indicates our confidence in that result. It is a Pearson correlation coefficient between past algorithmic performance and actual market movement. Measured from -1 to 1.
You can find a detailed description of our heatmap here.
The Stock Picking Method
The method in this evaluation is as follows:
We take the top X most predictable assets and, from them, we pick the top Y highest signals.
By doing so we focus on the most predictable assets on the one hand. On the other hand, capturing the ones with the highest signal.
For example, a top 30 predictability filter with a top 10 signal filter means that on each day we take only the 30 most predictable assets. Then we pick from them the top 10 assets with the highest absolute signals.
We use absolute signals since these strategies are long and short ones. If the signal is positive, then we buy and, if negative, we short.
The Stock Market Forecast Performance Evaluation Method
We perform evaluations on the individual forecast level. It means that we calculate what would be the return of each forecast we have issued for each horizon in the testing period. Then, we take the average of those results by strategy and forecast horizon.
For example, to evaluate the performance of our 1-month forecasts, we calculate the return of each trade by using this formula:
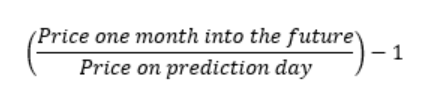

This simulates a client purchasing the asset based on our prediction and selling it exactly 1 month in the future.
We iterate this calculation for all trading days in the analyzed period and average the results.
Note that this evaluation does not take a set portfolio and follow it. This is a different evaluation method at the individual forecast level.
The Hit Ratio Method
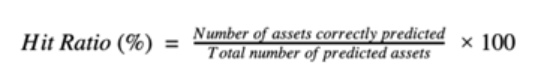
The hit ratio helps us to identify the accuracy of our algorithm’s predictions.
Using our Daily Forecast and Global Model asset filtering, we predict the direction of the movement of different assets. Our predictions are then compared against actual movements of these assets within the same time horizon.
The hit ratio is then calculated as follows:

The Benchmarking Method – S&P 500 Index
In order to evaluate our algorithm’s performance in comparison to the US market, we used the S&P 500 as a benchmark.
The S&P 500 measures the stock performance of the largest 500 companies by market cap listed on different stock exchanges in the United States. It is one of the most followed equity indices. It is frequently the best indicator for the overall performance of US public companies, and the US market as a whole. S&P 500 is a capitalization-weighted index. The weight of each company in the index is determined based on its market cap divided by the aggregate market cap of all the S&P 500 companies.
For each time horizon, we compare the S&P 500 performance with the performance of our forecasts after the filtering processes described above. For example: after our Global filtering the model recommended buying a given asset and hold it for three days on five different occasions, the S&P 500 performance we will use as a benchmark will be the average of returns only in these five intervals of three days.
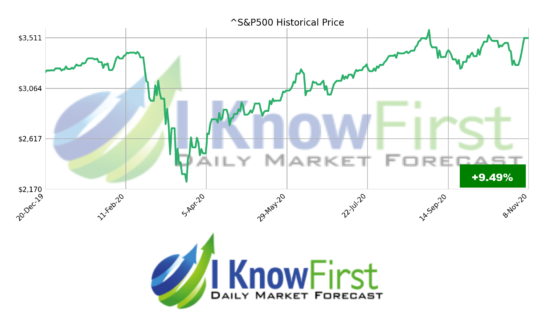
The effect of COVID-19 on S&P 500
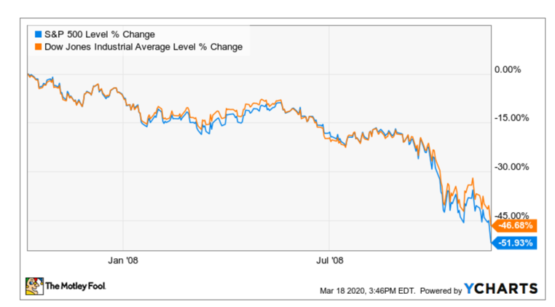
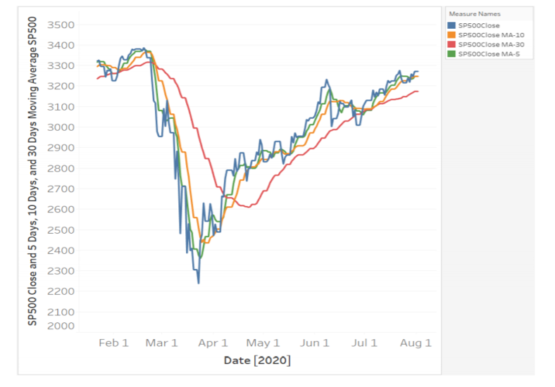
Understanding what is happening in the market with the S&P 500 stock index is important in predicting aggressive stocks. In March 2020 S&P 500 index dropped 33.68 % in around one month. The COVID-19 had led to one of the fastest U.S. stock market declines in history. Based on fool.com example the S&P 500 stock index in 2020 can be compared with the 2007-2009 Global Financial crisis. The S&P 500 down 52% from the pre-crash peak it hit in October 2007.

Although the US stock market started to recover in June, the pandemic’s economic impact remains very high. According to ripublication.com, from Figure 3, we can see the shorter-term moving average curves (5-day and 10-day) crossed above the longer-term 30-day moving average curve in April. This indicated a change in sentiment from bearish to bullish. The near future S&P 500 forecasting predicts that the stock market will remain increasing.

As reported by markets.businessinsider.com, strategists initiated a 2021 S&P 500 price target of 4,050, implying a 12% rally. They predicted that earnings per share would grow by 20% in 2021. Another 13% the following year as the US economy fully reopens and revenues rebound to pre-pandemic levels.
In conclusion, we can say that the US stock market will recover from the pandemic, and the S&P 500 stock index will rise in the near future. As a result., the most profitable investment for an investor will be the longest term as predicted by I Know First AI Algorithm.
Stock Universe Under Consideration – the Aggressive stocks Market
In this report, we conduct testing for the Aggressive stocks that I Know First cover by its algorithmic forecast in the “The Aggressive stocks” package. The period for evaluation and testing is from 20th December 2019 to 8th November 2020. During this period, we were providing our clients with daily forecasts for the Aggressive stocks. Also we provide the time horizons which we evaluate in this report are 4 periods spanning from 3 days to 1 month.
Evaluating the Signal Indicator for the Aggressive stocks
In this section, we will demonstrate how our stock-picking method can improve if we add the signal indicators.
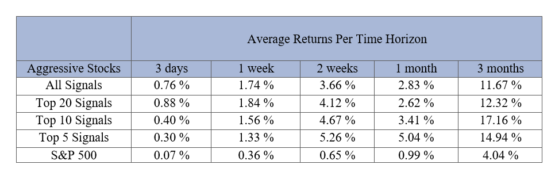


From Table 1, we can see that the percentage increases when signal strength is applied by considering the Aggressive stocks. This occurs from 3 days to 2 weeks. 1-month horizon shows a decrease in returns. We can also see a significant jump in returns from horizon to horizon. Also, when applying the signal strength, the return is higher than the benchmark in every time horizon.


The longer the time horizon, the higher the average return of the aggressive stocks package. The highest average return in the longest horizon of time was 3 months: for the Top 20 signals – 12.32%; for the Top 10 signals – 17.16%; for the Top 5 signals – 14.94%. The difference with the benchmark is almost 4 times for all Top Signals. The average return of the Top 5 Signals is higher in the time horizon from 2 weeks to 1 month than the Top 10 Signals.
It is important to realize that aggressive stocks are highly volatile. For stocks with high volatility, having a long-term investment outlook is ideal. On a long-time horizon, we can see a sizable change in the stock prices, irrespective of short-term downtrends.


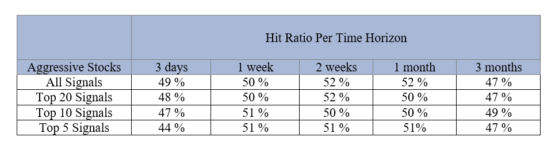
Hit Ratio Per Time Horizon Analysis
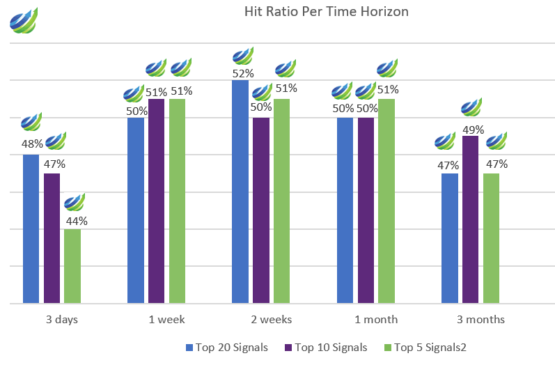

Figure 3:Hit Ratio Per Time Horizon
From Figure 3 we can conclude that the highest predictability reached 52% across all top signals on 2 weeks’ time horizon. During this period market fluctuations heavily influenced high volatility stocks. Thus, such fluctuations in stock prices can lead to losses for some investors pursuing short-term investment goals since the market’s downtrends can last up to a year. From the information above, we can conclude that the most profitable option for an investor will be a longer period, in our case, 10 best signals with 3 months.
Conclusion
This evaluation report presented the performance of I Know First’s algorithm for the aggressive stocks from 20th December 2019 to 8th November 2020. The algorithm is outperforming the benchmark index in most of the time periods. The I Know First algorithm has obtained better performance for the 3-month time horizon. Due to the high volatility of aggressive stocks having a long-term investment outlook is ideal. We can see a sizable change in the stock prices, irrespective of short-term downtrends.
It is also important to note that the US stock market is expected to recover from the pandemic, and the S&P 500 stock index will rise in the near future. S&P 500 price target implying a 12% rally in 2021. Therefore, the most profitable average return for an investor will be the longest term as predicted by the I Know First AI Algorithm.