

Bovespa Stocks Analysis: I Know First Evaluation Report
Executive Summary
In this Bovespa stocks analysis forecast evaluation report, we will examine the performance of the forecasts generated by the I Know First AI Algorithm for short-term and long-term stocks from the Bovespa Stock Exchange which is sent to our customers on a daily basis. Our analysis covers the time period from 1 January 2019 to 30 July 2019. We will start with an introduction to our asset picking and benchmarking methods and then apply it to the Bovespa stock universe as covered by the I Know First’s “Brazilian Stocks” package. We will then compare returns based on our algorithm with the benchmark performance over the same period.


Bovespa Stocks Analysis Highlights:
- The best returns were obtained in the 3 months time horizon, with the best performance being a return of 4.71% for the top 10 predictability and signal filtered assets during this time-horizon.
- All signals in the 3-month time horizon beat the benchmark, with the best outperformance being the top 10 assets which beat the benchmark by over 79%.
- The best hit ratios were similarly obtained for the 3 months time horizon, with the best hit ratio being 60% for the top 10 predictability and signal filtered assets.
Note that the above results were obtained as a result of evaluation conducted over the specific time period to give a general presentation of the forecast performance patterns for Bovespa stocks. The following report provides extensive explanation on our methodology and detailed analysis of the performance metrics that we obtained during the evaluation. This report is a new I Know First evaluation series illustrating the ability to provide successful long term and flexible forecasting for Bovespa stocks analysis.
About the I Know First Algorithm
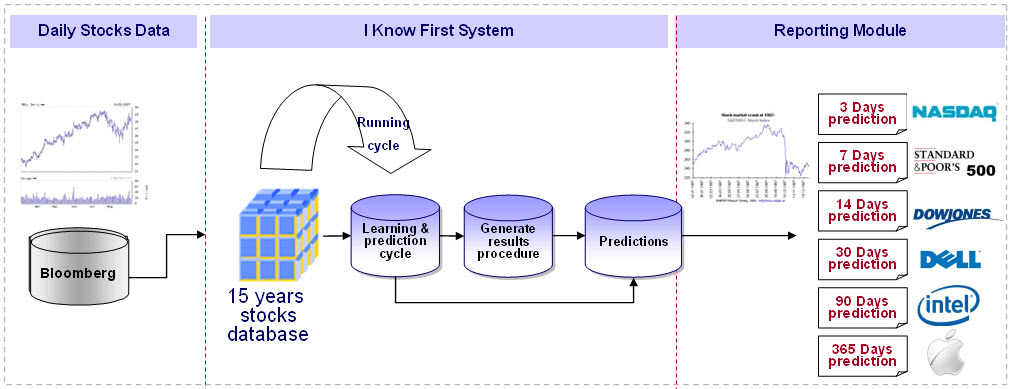
The I Know First self-learning algorithm analyzes, models, and predicts the capital market, including stocks, bonds, currencies, commodities and interest rates markets. The algorithm is based on Artificial Intelligence (AI) and Machine Learning (ML), and incorporates elements of Artificial Neural Networks and Genetic Algorithms.
The system outputs the predicted trend as a number, positive or negative, along with a wave chart that predicts how the waves will overlap the trend. This helps the trader to decide which direction to trade, at what point to enter the trade, and when to exit. Since the model is 100% empirical, the results are based only on factual data, thereby avoiding any biases or emotions that may accompany human derived assumptions. The human factor is only involved in building the mathematical framework and providing the initial set of inputs and outputs to the system. The algorithm produces a forecast with a signal and a predictability indicator. The signal is the number in the middle of the box. The predictability is the number at the bottom of the box. At the top, a specific asset is identified. This format is consistent across all predictions.
Our algorithm provides two independent indicators for each asset – signal and predictability.
The signal is the predicted strength and direction of movement of the asset. This is measured from -inf to +inf.
The predictability indicates our confidence in that result. It is a Pearson correlation coefficient between past algorithmic performance and actual market movement. This is measured from -1 to 1.
You can find a detailed description of our heatmap here.
The Asset Picking Method
The method in this evaluation is as follows:
To fully utilise information provided by our forecast, we filter out the top X most predictable assets and rank them according to their predictability value. Thereafter, from them, we pick the top Y highest signals and re-adjust the rankings accordingly.
By doing so we focus on the most predictable assets on the one hand, while capturing the ones with the highest signal on the other.
For example, a top 30 predictability filter with a top 10 signal filter means that on each day we take only the 30 most predictable assets from our asset universe, and then we pick from them the top 10 assets with the highest absolute signals. On the other hand, a top 30 predictability filter with a top 30 signal filter would imply that we are solely filtering based on predictability, since we are selecting all assets in this particular set which have already been filtered by predictability.
We use absolute signals since these strategies are long and short ones. If the signal is positive, then we buy assets, i.e. open long position and, if negative, we open short position on such asset. This is to help us to identify the assets with the maximum magnitude of change, which is indiscriminate as to whether one adopts a short or long position.
The Performance Evaluation Method
We perform evaluations on the individual forecast level. This means that we calculate the return of each forecast we have issued for each horizon in the testing period. We then take the average of those results based on our positions on different assets and forecast horizon.
For example, to evaluate the performance of our 1-month forecasts, we calculate the return of each trade by using this formula:
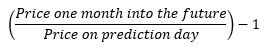
This simulates a client purchasing the asset on the day we issue our prediction and selling it exactly 1 month in the future from that day.
We iterate this calculation for all trading days in the analyzed period and average the results.
Note that this evaluation does not take a set portfolio and follow it. This is a different evaluation method at the individual forecast level.
The Hit Ratio Calculation
The hit ratio helps us to identify the accuracy of our algorithm’s predictions.
Using our asset filtering method based on predictability and signal, we predict the direction of movement of different assets. Our predictions are then compared against actual movements of these assets within the same time horizon.
The hit ratio is then calculated as follows:

For instance, a 90% hit ratio for a top 30 predictability filter with a top 10 signal filter would imply that the algorithm correctly predicted the price movements of 9 out of 10 assets within this particular set of assets.
The Benchmarking Method
The Bovespa index is used as a benchmark. Stocks should be bought (or shorted) when they have been identified to have high signal strength and high predictability. We compare our rate of return based on purchasing (or shorting) the top X assets after applying both the predictability and signal filters with the rate of return of the Bovespa index in the same time horizon, from 1 January 2019 to 30 July 2019 in a long position. This helps us to determine the effectiveness of our algorithm by comparing the rate of return of the benchmark against the average investor returns.
Asset Universe Under Consideration: Bovespa Stocks
In this Bovespa stocks analysis report, we conduct testing for stocks trading on the Bovespa Stock Exchange that I Know First covers in its algorithmic forecast in the Brazilian Stocks package.
Performance Evaluation: Evaluating the predictability indicator
We conduct our research for the period from 1 January 2019 to 30 July 2019. Following the methodology as described in the previous sections, we start our analysis by computing the performance of the algorithm’s long and short signals for time horizons ranging from 3 days to 3 months, without first considering the signal indicator. We apply filtering by the predictability indicator to investigate its sole marginal contribution in terms of return, and observe how returns change as these different filters are applied. Afterwards, we calculate the returns for the same time horizons for the benchmark using the stocks universe and compare it against the performance of the filtered sets of assets.
In our evaluation of the predictability indicator, the benchmark that is used is the Bovespa Stock Index. Our findings for this section of our Bovespa stocks analysis are summarized in the table below:

From the above table, we can observe that the top 30 assets outperformed the benchmark for the medium-term time horizon of 3 months. The best performance for predictability-filtered assets relative to the benchmark returns is recorded for the 3-month horizon, which exceeded benchmark returns by 1%.
Overall, by comparing between the rate of returns for the top 30 predictability assets and the benchmark, this suggests that it could be more valuable to filter out and invest into the top predictable assets for potentially greater returns.
Based on the above Bovespa stocks analysis, we continue our study to identify whether the results could be improved when we filter by signal indicator.
Performance Evaluation: Evaluating the Signal indicator
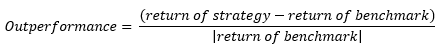
In this section, we will demonstrate how adding the signal indicator to our asset picking method improves the above performance even further. It is important to measure the performance of our strategy with respect to the benchmark, and for that we will apply the formula:
We further filtered the assets based on signal strength, which were previously already filtered by predictability. The results of the testing showed that there is a significant positive marginal effect on the assets’ return. We present our findings in the following table and charts.
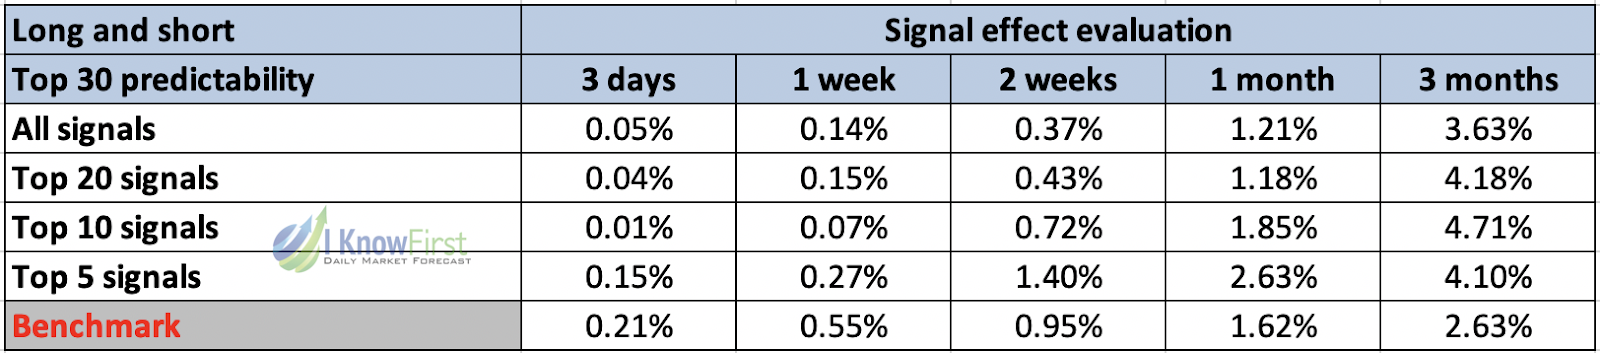
We further filtered the assets based on signal strength starting from the Top 30 assets, which were previously already filtered by predictability. By doing this, we can ascertain how investors can select and filter stocks based on forecasts generated by the I Know First algorithm. The results of the testing showed that there is a positive marginal effect on the assets’ return in doing so.
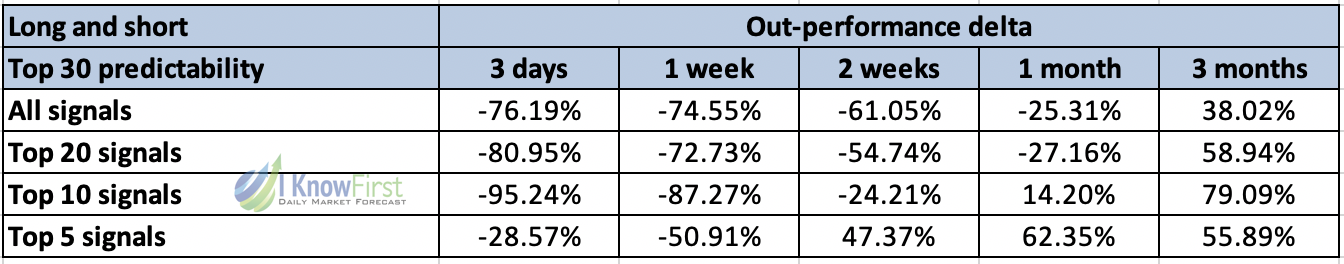
From the above set of charts, we can clearly see that all returns are positive. Additionally, in general, if we apply signal strength filtering to the Bovespa stock universe, the best performance can be observed in the medium time horizon of 3 months. Most notably, the Top 5 signals are more likely to produce much greater returns than the benchmark, as observed from the outperformance delta.
When we look at medium term performance, we observe that the top 5 predictability and signal filtered assets tended to produce the best results, across all time horizons. For the 3- months time horizon, returns for the top 5 signals were more than 79% of the benchmark. For the 1 month time horizon, we also observe that top 5 signals produced returns that were more than 62% of the benchmark as well. Similarly, the top 5 signals produced returns that were more than 47% of the benchmark in the 2 week time horizon. By applying the predictability and signal filters, investors can be assured of identifying assets with a higher probability of significant returns, regardless of the time horizon.

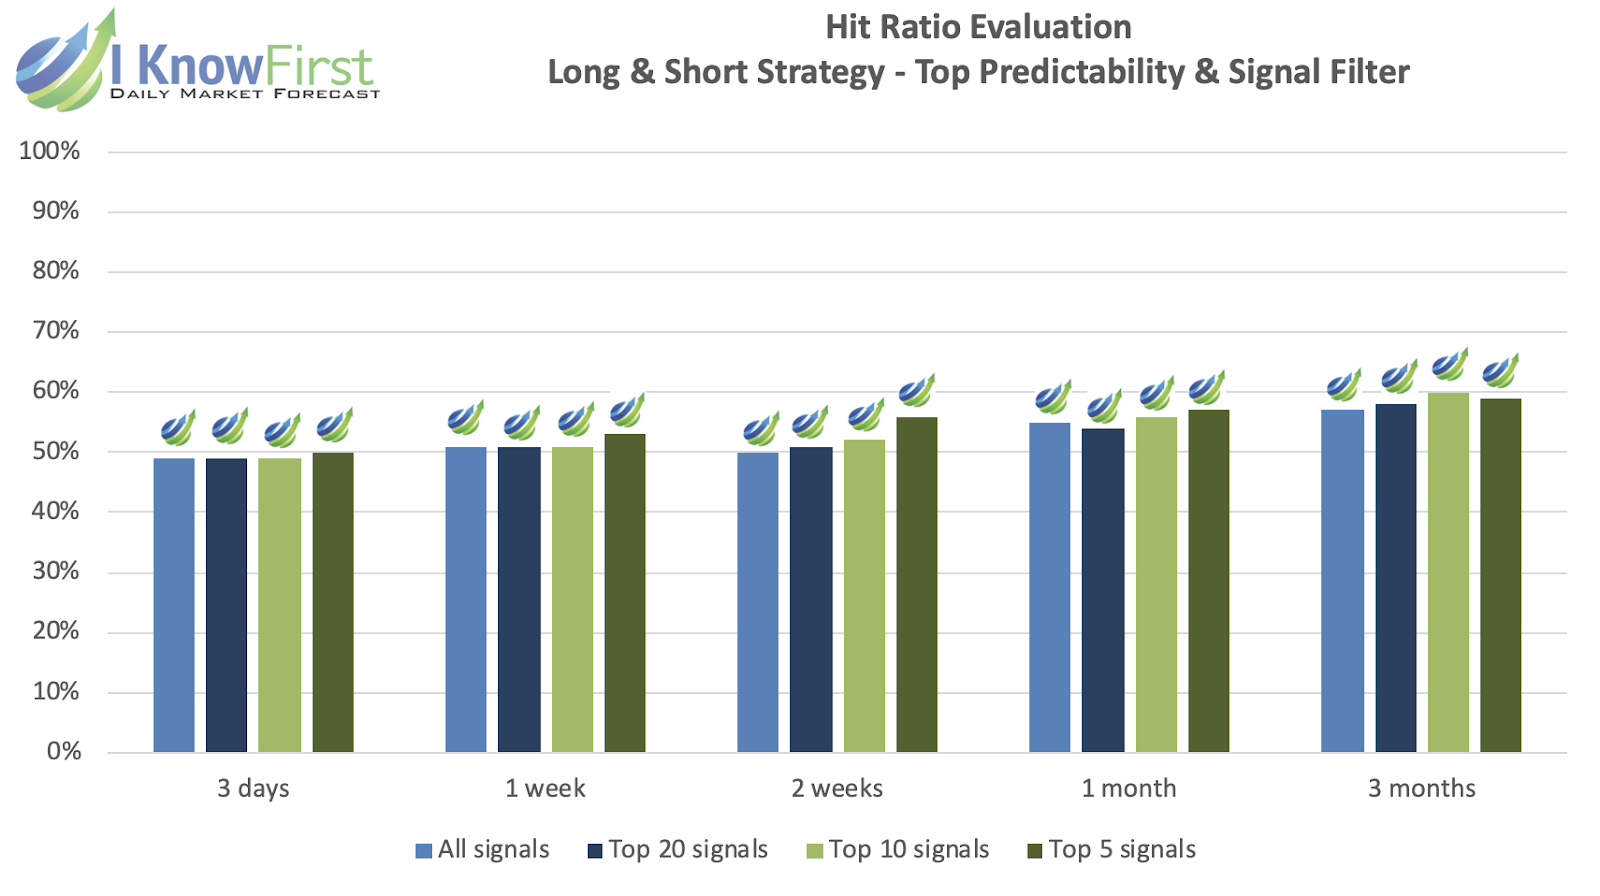
Hit ratios are important for the investor using I Know First’s proprietary AI algorithm. The investor is interested in understanding how an unadulterated portfolio would compare against one that uses the algorithm. When we consider the hit ratios for this particular set of assets, we note that even though there are cases in which the hit ratio is slightly less than 50%, the fact that the returns are positive indicates that the correct forecasts had high returns.
Additionally, we see that in general, for longer time horizons, the hit ratio is likely to improve over time, with hit ratios for all signals, top 20, top 10 and top 5 predictability and signal filtered assets being at least 57% in the 3 months time horizon. In the case of the 3 months, top 5 signals category where the hit ratio is 59%, we are able to obtain excellent returns of 4.71%, which exceeds the rate of return of the Bovespa index benchmark. Given this excellent track record, this is a reflection of the legitimacy of the artificial intelligence algorithm in predicting the price movement of assets within the Bovespa stock universe.
Conclusion
In this Bovespa stocks analysis, we demonstrated the out-performance of our forecasts for stocks from the Bovespa stock universe picked by I Know First’s AI Algorithm during the period from 1 January 2019 to 30 July 2019. Based on the presented observations, we record significant out-performance of Top 5 assets when our signal indicators are used as an investment criterion. As shown in the above diagram, the Top 5 assets filtered by signal yield significantly higher returns than any other asset subset on all considered time horizons spanning from 3 days to 3 months. Thus, an investor who wants to critically improve the structure of his investments into the Brazilian stock market within his portfolio can do so by simultaneously utilizing the I Know First predictability and signal indicators as criteria for identifying the best performing stocks from the Bovespa stock universe.