

Low P/E Stock: AI Stock Predictions Beat Market 5 Times Amid COVID-19
Executive Summary
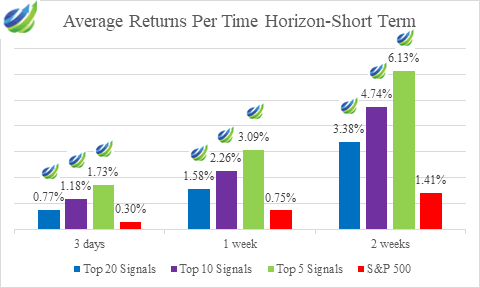
The purpose of this Low P/E Stock forecasts report is to present the results of the live forecast performance evaluation for the Low P/E Stock package by the I Know First AI Algorithm. The following results were observed when signal and predictability filters were applied to pick the best-performing stocks out of the most predictable ones. The evaluation period is from 1st January 2020 to 30th March 2021. The corresponding returns distribution of stock signal filters for this package is shown below:


The Low P/E Stock Package Highlights:
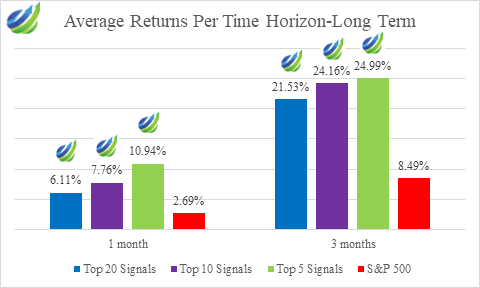
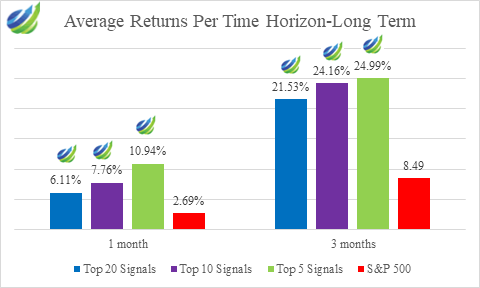
- 24.99 % – the highest average return for an investor is reached by the Top 5 Signals using 3-months’ forecasts
- Predictions reach up to 65% hit ratio regardless of economic conditions amid COVID-19
- The Top 5 Signals stocks subset outperformed the S&P 500 by 5.8 times on the 3-days’ time horizon
About the I Know First Algorithm
The I Know First self-learning algorithm analyzes, models, and predicts the stock market. The algorithm is based on Artificial Intelligence (AI) and Machine Learning (ML) and incorporates elements of Artificial Neural Networks and Genetic Algorithms.

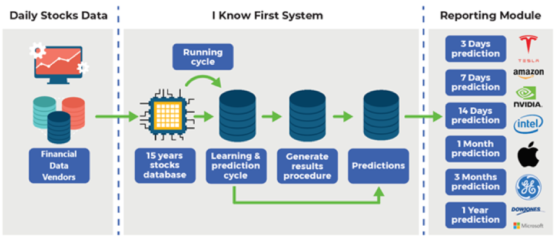
The system outputs the predicted trend as a number, positive or negative, along with a wave chart that predicts how the waves will overlap the trend. This helps the trader to decide which direction to trade, at what point to enter the trade, and when to exit. Since the model is 100% empirical, the results are based only on factual data, thereby avoiding any biases or emotions that may accompany human derived assumptions.
The human factor is only involved in building the mathematical framework and providing the initial set of inputs and outputs to the system. The algorithm produces a forecast with a signal and a predictability indicator. The signal is the number in the middle of the box. The predictability is the number at the bottom of the box. At the top, a specific asset is identified. This format is consistent across all predictions.
Our algorithm provides two independent indicators for each asset – Signal and Predictability.
The Signal is the predicted strength and direction of the movement of the asset. Measured from -inf to +inf.
The predictability indicates our confidence in that result. It is a Pearson correlation coefficient between past algorithmic performance and actual market movement. Measured from -1 to 1.
You can find a detailed description of our heatmap here.
The Stock Market Forecast Performance Evaluation Method
We perform evaluations on the individual forecast level. It means that we calculate what would be the return of each forecast we have issued for each horizon in the testing period. Then, we take the average of those results by strategy and forecast horizon.
For example, to evaluate the performance of our 1-month forecasts, we calculate the return of each trade by using this formula:

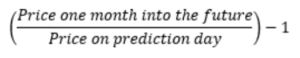
This simulates a client purchasing the asset based on our prediction and selling it exactly 1 month in the future.
We iterate this calculation for all trading days in the analyzed period and average the results.
Note that this evaluation does not take a set portfolio and follow it. This is a different evaluation method at the individual forecast level.
The Hit Ratio Method
The hit ratio helps us to identify the accuracy of our algorithm’s predictions.
Using our Daily Forecast asset filtering, we predict the direction of the movement of different assets. Our predictions are then compared against actual movements of these assets within the same time horizon.
The hit ratio is then calculated as follows:
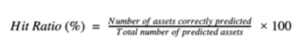

For instance, a 90% hit ratio for a predictability filter with a top 10 signal filter would imply that the algorithm correctly predicted the price movements of 9 out of 10 assets within this particular set of assets.
The Benchmarking Method – S&P 500 Index
In order to evaluate our algorithm’s performance in comparison to the US market, we used the S&P 500 index as a benchmark.
The S&P 500 measures the stock performance of the largest 500 companies by market cap listed on different stock exchanges in the United States. It is one of the most followed equity indices and is frequently used as the best indicator for the overall performance of US public companies, and the US market as a whole. The S&P 500 is a capitalization-weighted index, the weight of each company in the index is determined based on its market cap divided by the aggregate market cap of all the S&P 500 companies.
For each time horizon, we compare the S&P 500 performance with the performance of our forecasts.
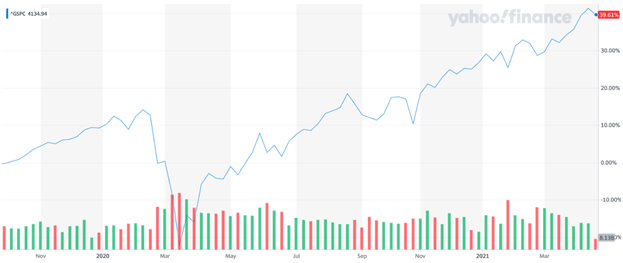
Low P/E Stock Amid COVID-19
The S&P 500 grew by some 40% over the analyzed period. When COVID-19 introduced itself, it had a catastrophic impact on the stock market. The S&P 500 decreased by 34% from February 20th, 2020 to March 23rd, 2020, but soon after the S&P 500 began recovering and revisited its pre-pandemic level of August 2020.

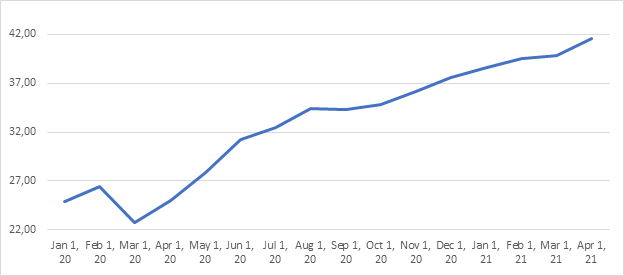
One of the most popular indicators, which is used to determine an overvalued/undervalued stock is the P/E ratio. This ratio takes into account the fundamental idea of investment: a price, which an investor pays for a stock, and a value, which he buys. The S&P 500’s P/E ratio got its minimum level on March 2nd, 2020, and reached the pre-pandemic level at the end of April 2020 because of earning also decreased. At the end of the study period, the S&P 500’s P/E ratio reached 41.52, which was significantly higher than its mean and median historical values of 15.92 and 14.85, respectively, indicating that the market was overvalued.

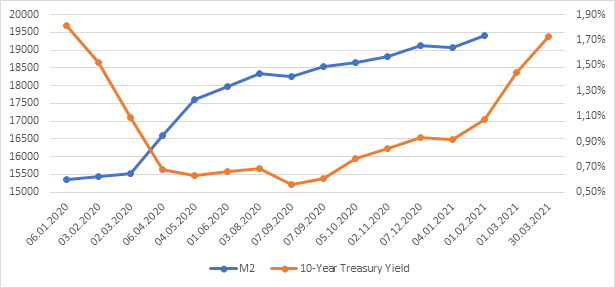
To support the stock market during the COVID-19 crisis the US money supply was significantly increased by 26% for the period January 6th, 2020 – February 1st, 2021, in addition, Biden’s $1.9 trillion COVID-19 relief bill was approved by the US Senate in March 2021. Despite that the 10-Years Treasury yield has reached its pre-pandemic level of 1.7% on March 30th, 2021 which did not have a significant negative impact on the S&P 500’s P/E ratio.

COVID-19 has become a «Black Swan» for the global economy that not only had a catastrophic impact on financial assets but also disrupted business processes. The high P/E value can be explained by the expectation of revenue growth within recovering economy context. Today the current market situation can change fast and we need to be able to predict market trends using multi-dimensional data to make informed investment decisions. Machine learning algorithms and artificial intelligence are the best instruments that allow fast data processing and analytics and offer the most cost-efficient for making investment decisions
AI Beats S&P 500 Across All Time Horizons By Up To 16.50%
In this section, we will demonstrate how our stock-picking method can improve if we use filtering by signal indicators.
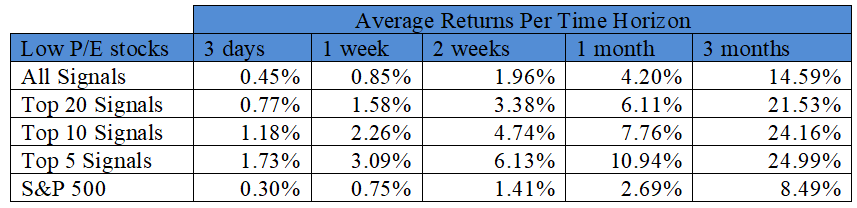

We can see from the above table that the return generally increases when signal filtering is strengthened. Every signal group for every time horizon outperformed the S&P 500 by at least 0.10%. For the 3-days time horizon, the Top 5 Signals group significantly outperformed the benchmark index – by more than 5.8 times resulting in an average return of 1.73% versus the S&P 500’s 0.30%. We can observe the highest average return of 24.99% by the Top 5 Signals on 3-months’ forecasts.


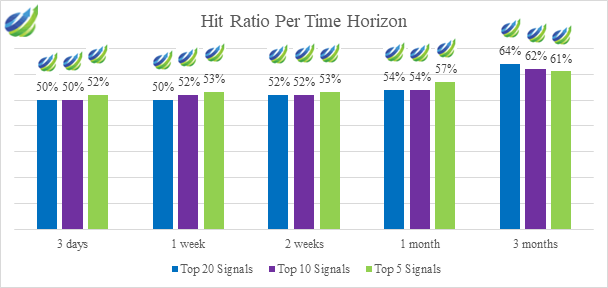
Navigating Chaotic Market – Algorithm’s Accuracy Reached 65% Amid Global Pandemic
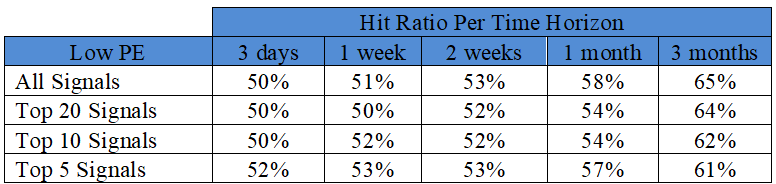

According to the table above, each signal group across every time horizon gave a hit ratio greater than 50%. This shows that the algorithm’s accuracy is consistent and reliable amid the COVID-19 crisis. For example, the Top 5 Signals group for the 3-months time horizon had a hit ratio of 61% and a return that outperformed the S&P 500 Index by a large margin, suggesting the consistent accuracy of the algorithm. The Top 20, Top 10, and Top 5 signal group for all time horizons all gave a hit ratio of 61-64% accuracy.

Conclusion
This evaluation report presented the performance of I Know First’s algorithm for the Low PE stock from 1st January 2020 to 30th March 2021. The algorithm is outperforming the benchmark index on all of the forecasting time horizons. For someone utilizing Low P/E stocks forecasting package and interested in short-term investment, the Top 5 Signals is the most suitable option on 2-weeks’ horizon. It is also worth considering the Top 5 Signals for longer investments by utilizing a 1-month time horizon or Top 20 Signals on 3-months’ forecasting. Given the severe turmoil in the economy due to the pandemic being reflected in the current stock prices and corresponding rolling P/E ratios, the I Know First AI-powered forecasting algorithm performed well. Moreover, this report shows significant improvements in comparison to the previous evaluation in terms of performance on 3-months’ time horizon. We can conclude that investors seeking to improve their portfolios by adding Low P/E stocks to their portfolios while using the I Know First predictability indicator and signal values to pick the best stocks.