

ETF Trading Strategies Based on I Know First’s Aggregated Algorithmic Forecasts
In the following article we update a set of ETF trading strategies based on I Know First’s aggregated investment signals for the individual stocks contained within the funds. ETF forecasts are generated by using a weighted aggregation of stock-level forecasts and its performance is tested by constructing an algorithmic portfolio for the SPDR Sector ETFs. We show that these aggregated forecasts result in ETF trading strategies which outperform the benchmark and present excellent performance and risk statistics.
I Know First Overview
I Know First is an Israeli Fintech company that brings artificial intelligence to the financial world by providing daily investment forecasts based on an advanced self-learning algorithm. This algorithm generates investment predictions for a universe of over 8200 assets which result in a daily ranking of investment opportunities. These can easily be integrated into investment selection processes and, combined with the appropriate strategy, be translated into portfolios with outstanding statistics for all types of investors.
Here we focus on ways of constructing ETF predictions from weighted individual stock level predictions. We then use these types of investment signals to build trading strategies for the 9 SPDR Sector ETFs and the Vanguard Real Estate Sector ETF individually and as a portfolio of ETFs. These investment funds contain S&P 500 stocks grouped by GICS sector classification and facilitate passive exposure to specific sectors of the US economy.
ETF Forecast Computed Using Weighted Stock-Level Forecast Aggregation
The general concept behind this ETF forecast is to combine the information from individual, stock-level forecasts for the assets contained within the ETF to decide whether we are bullish, bearish, or neutral for the entire fund. For the method presented in this article we take the components and weights of the stocks the ETF is made up of as stated on the ETF provider’s website and map them to our daily algorithmic stock forecasts. Thus, we sum the weights for which our predictions are long and those for which they are short and divide by the total sum of the weights, which gives the weighted percentage of stocks within the ETF in each direction. Finally, we use a fixed threshold level to compute the final ETF forecast: if neither percentage passes the threshold we set the ETF forecast to neutral. This process results in a daily investment decision the performance of which is shown below through backtests of investment strategies.
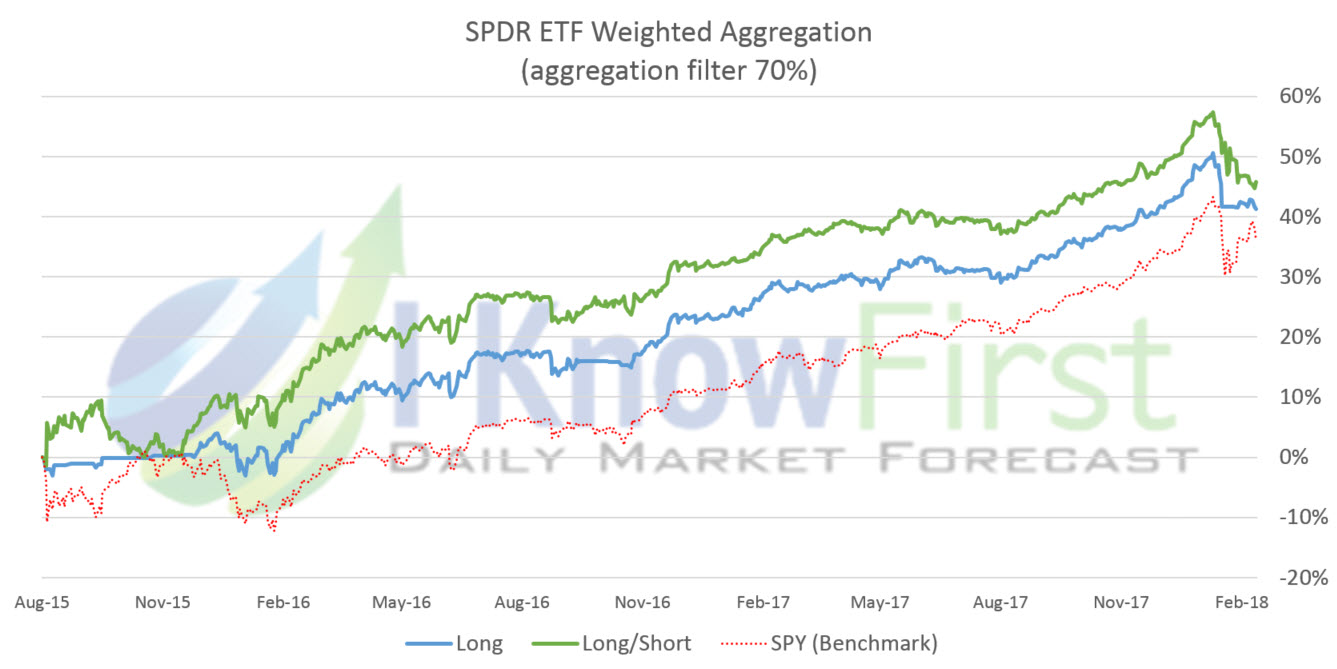
Performance of an ETF Trading Strategy Based on the Aggregated Predictions
Here we build an ETF trading strategy which invests equally in the 11 SPDR Sector ETFs in the direction given by the aggregated forecast.
The following table gives the performance of this strategy for the period 08/18/2015-02/28/2018 for a long/short and long-only portfolio (where all short predictions are treated as neutral) restricted to allocate at most 25% of the portfolio value to any individual ETF. The performance of the portfolio is compared to that of the SPY (ETF that tracks the performance of the S&P 500 index).

The portfolios present excellent portfolio statistics with Total Returns of 45% and 41% over the 2.5-year period, strongly outperforming the benchmark’s 35%, Sharpe Ratios above 1.4 versus the benchmark’s 1.05, and annualized alpha of 17% and 9%.
Below we show the equity lines for the two strategies (blue and green) against the benchmark (in red).
 Conclusion
In this article, we presented results of using ETF predictions computed through the weighted aggregation of I Know First’s algorithmic stock predictions of the stocks which compose the ETF. Investment strategies based on these forecasts outperform their relative benchmarks on both an individual ETF level and for a portfolio of ETFs with the final ETF portfolios constructed using the weighted aggregation over a two-year period yielding:
- Total Returns of 45% and 41% versus the benchmark’s 35%
- Sharpe Ratios of 1.44 and 1.73 versus the benchmark’s 1.05
- Annualized Alpha of 17% and 9%