Stock Market Forecast for Major US Indexes Reaches 70% Accuracy Despite Market Volatility
Stock Market Forecast Executive Summary
In this evaluation report, we examine the stock market forecast for indexes to assess the performance of the predictions generated by the I Know First AI Algorithm. It was made for the top US stock market indexes – S&P 500, Nasdaq, Dow Jones Industrial and Transportation Indexes, as well as Russel 2000 – with time horizons ranging from 3 days to 1 year, which were delivered daily to our clients. Our analysis covers the time period from 1st November 2020 to 21st February 2022. Below, we present our key takeaways for checking the hit ratios of our stock market predictions.


Stock Market Forecast Highlights:
- The best hit Ratio is 100% for the 1-year time horizon for SPY ETF, Dow Jones Industrial and Transportation Indexes
- S&P500 is reaching 90% accuracy for the 3-month time horizon
- Our performance evaluation period covers the Covid-19 times, yet all the forecasts are still more than 50% accurate for all time horizons except Russell 2000
Note that the above results were obtained as a result of an evaluation conducted over a specific time period to give a presentation for the S&P 500 and Nasdaq movements. The following report provides an extensive explanation of our methodology and a detailed analysis of the performance metrics that we obtained during the evaluation. This report continues the I Know First evaluation series illustrating the ability to provide successful forecasting on the Nasdaq and S&P 500 indices.
Stock Market Forecast Algorithm
The system is a predictive stock market forecasting algorithm based on artificial intelligence and machine learning with elements of artificial neural networks and genetic algorithms incorporated in it.

The I Know First Market Prediction System models and predicts the flow of money between the markets. It separates the predictable information from any “random noise”. It then creates a model that projects the future trajectory of the given market in the multidimensional space of other markets.
The system outputs the predicted trend as a number, positive or negative, along with the wave chart that predicts how the waves will overlap the trend. This helps the trader decide which direction to trade, at what point to enter the trade, and when to exit.
The model is 100% empirical, meaning it is based on historical data and not on any human-derived assumptions. The human factor is only involved in building the mathematical framework and initially presenting to the system the “starting set” of inputs and outputs.
From that point onward, the computer algorithms take over, constantly proposing “theories”, testing them on years of market data, then validating them on the most recent data, which prevents over-fitting. If an input does not improve the model, it is “rejected” and another input can be substituted.
This bootstrapping system is self-learning and thus live. The resulting formula is constantly evolving, as new daily data is added and a better machine-proposed “theory” is found.
Some stocks are members of several separate modules. Thus, multiple predictions can be obtained based on different data sets. Also, each module consists of a number of sub-modules, each giving an independent prediction. If sub-modules give contradictory predictions, this should be a warning sign. Six different filters are also employed to refine the predictions.
Learn How To Strategize With The Algorithm To Optimize Gains And Mitigate Risk
Stock Market Forecast Hit Ratio Calculation
The hit ratio helps us to identify the accuracy of our algorithm’s predictions.
We predict the direction of the movement for the S&P 500 and Nasdaq indices using our algorithm. Our predictions are then compared against actual movements of the S&P 500 and Nasdaq benchmarks respectively within the same time horizon.
The hit ratio is then calculated as follows:

S&P 500 Index and SPY ETF
When thinking of major stock market indexes as benchmarks for the whole US economy, many experts tend to gravitate towards checking the S&P 500. This prominent index, followed by millions throughout the globe, has historically shined a light on the movements in the stock market. What the index does, in essence, is to choose the 500 largest publicly traded companies by order of market capitalization and produce a list of corporations to be tracked. It is clear that any preemptive indication of how those shares appreciate or depreciate could be a powerful and highly profitable tool for investors.
At the same time SPY is the best-recognized and oldest ETF and typically tops rankings for largest AUM and greatest trading volume. The fund tracks the massively popular US index, the S&P 500. Few realize that S&P’s index committee chooses 500 securities to represent the US large-cap space—not necessarily the 500 largest by market cap, which can lead to some omissions of single names. Still, the index offers outstanding exposure to the US large-cap space. SPY is a unit investment trust, an older but entirely viable structure. It can’t reinvest portfolio dividends between distributions; the resulting cash drag will slightly hurt performance in up markets and help in downtrends. SPY is extremely cheap to hold and SPY’s phenomenal trading volume makes it the perfect vehicle for tactical traders and mom and pop investors alike.
NASDAQ Index and QQQ ETF
On the other hand, when looking towards the health of growth-oriented stocks, a majority within the world of investing points toward the Nasdaq as the strongest indicator. The index focuses on mostly technology and internet-related firms, but also contains many financial, consumer, biotech, and industrial companies. The Nasdaq Composite, the leading index for the group, tracks over 3,300 stocks including Apple (AAPL), Intel (INTC), Facebook (FB), and Microsoft (MSFT).
Finally, QQQ is one of the best established and most traded ETFs in the world. It’s also one of the most unusual. Per the rules of its index, the fund only invests in non-financial stocks listed on NASDAQ, and effectively ignores other sectors too, causing it to skew massively away from a broad-based large-cap portfolio. QQQ has huge tech exposure, but it is not a ‘tech fund’ in the pure sense either. The fund’s arcane weighting rules further distance it from anything close to plain vanilla large-cap or pure-play tech coverage. The ETF is much more concentrated in its top holdings and is relatively volatile. Still, it is extremely large and liquid and has huge name recognition for the underlying index, the NASDAQ-100.
Russell 2000 and Dow Jones Transportation Indexes
As far as Coronavirus impacted the US economy thoroughly we consider it important to evaluate the predictive power of our AI algorithm in the respect of indexes that represent the transportation sector as well as the small-capitalization companies cluster. Logically, we analyzed the hit ratio data for Russell 2000 and Dow Jones transportation indexes over the same period.
The Russell 2000 index measures the performance of the 2,000 smaller companies that are included in the Russell 3000 Index, which itself is made up of nearly all U.S. stocks. The Russell 2000 is widely regarded as a bellwether of the U.S. economy because of its focus on smaller companies that focus on the U.S. market.
The Dow Jones Transportation Average (also called the “Dow Jones Transports”) is a U.S. stock market index from the S&P Dow Jones Indices of the transportation sector and is the most widely recognized gauge of the American transportation sector. It is the oldest stock index still in use, even older than its better-known relative, the Dow Jones Industrial Average (DJIA). The index is a running average of the stock prices of twenty transportation corporations, with each stock’s price-weighted to adjust for stock splits and other factors. As a result, it can change at any time the markets are open. The figure mentioned in news reports is usually the figure derived from the prices at the close of the market for the day.
High Volatility of Top US Stock Market Indexes from November 2020 to February 2022
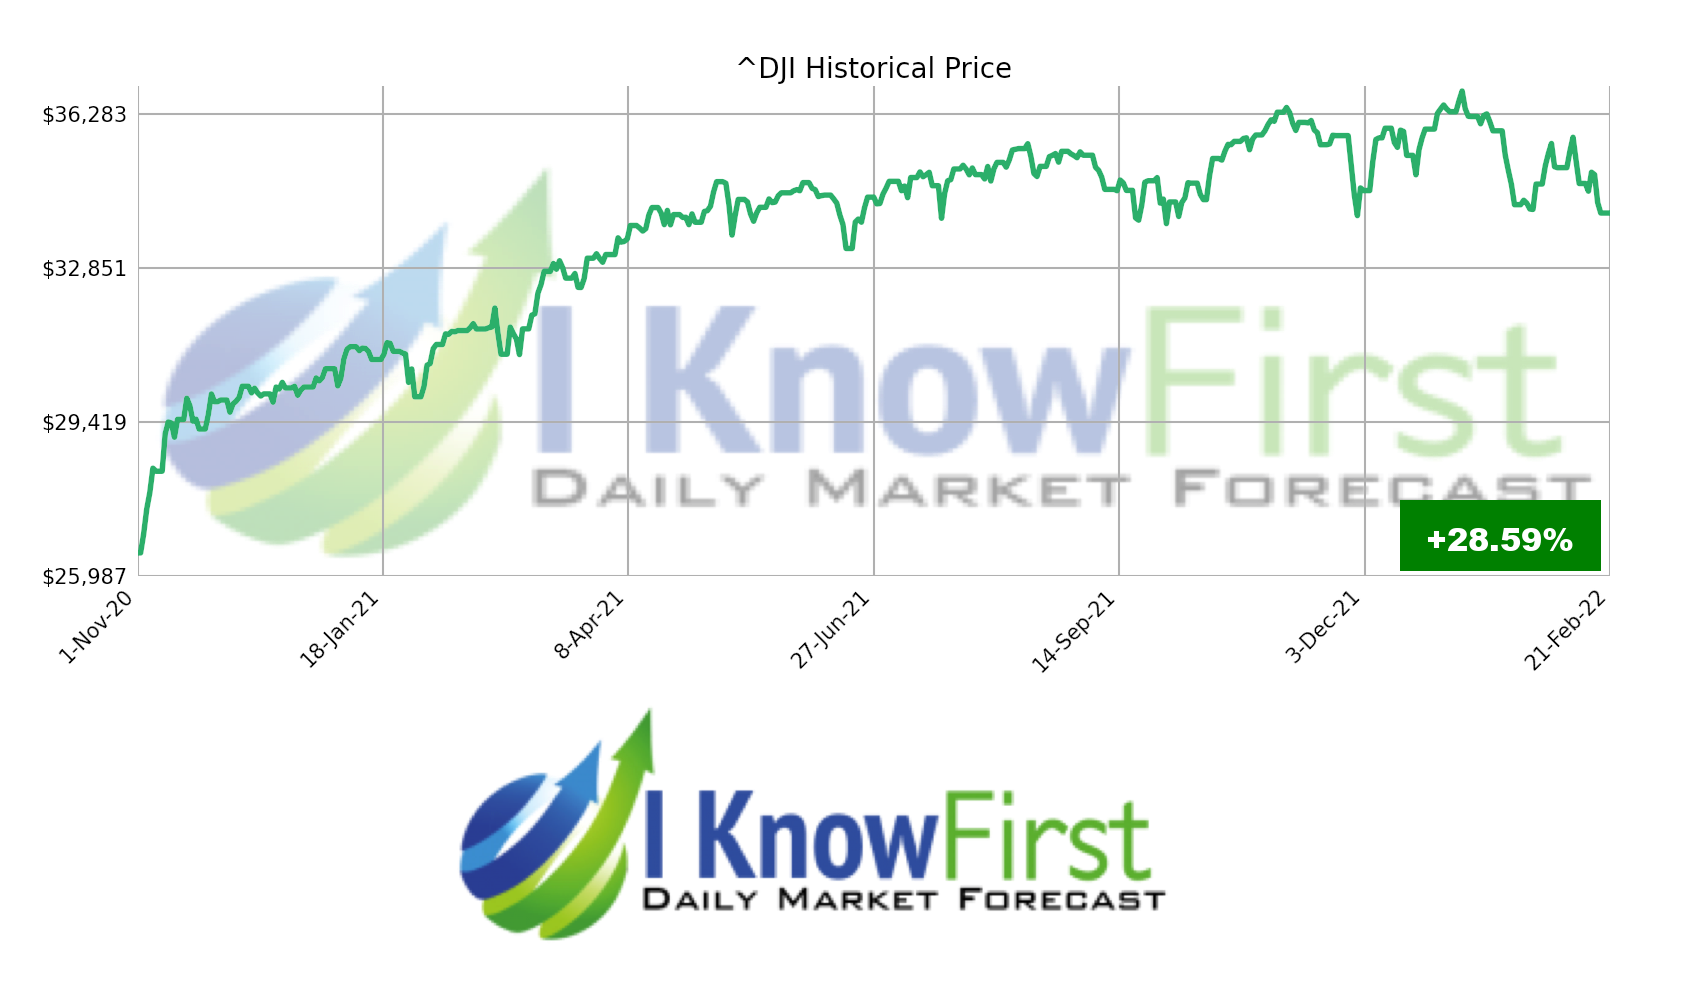
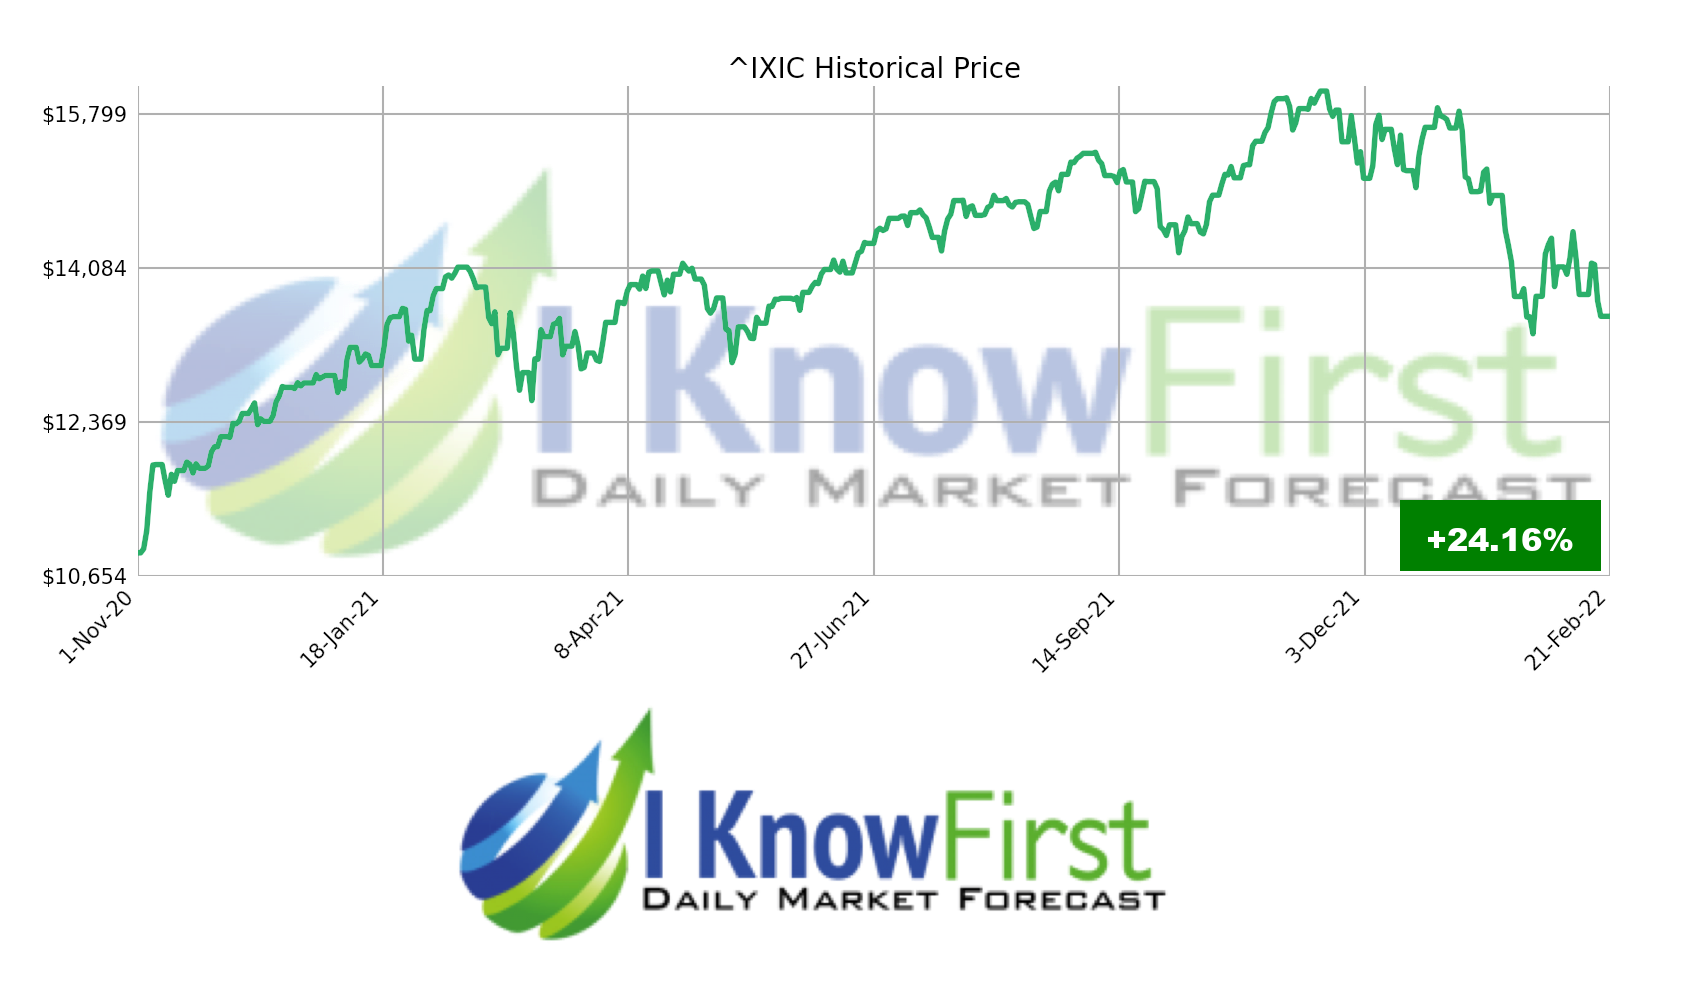
Over the considered period the US economy experienced significant volatility across all the sectors. The measures for developing and distributing vaccines against COVID-19 in the first quarter of 2021 supported the growth of economic activity and highlighted the debate about inflation expectations. The active government support of the economy allowed reducing volatility to the pre-pandemic level at the end of June 2021. After that time point, the threat of inflation, which is a consequence of the previous government stimulation, came to the fore. We noticed a surge in volatility before the FOMC meeting on January 26th, 2022, where the FOMC discussed possibly increasing the target range for the federal funds rate and reducing the monthly pace of its net asset purchases.

Therefore, the consideration of S&P 500 and NASDAQ, as well as the above-mentioned ETFs, is accompanied in this report by Russell 2000 and Dow Jones Transportation indexes consideration. The I Know First R&D team also records increasing demand for a reliable and consistent prediction algorithm from investors and analysts community. Meanwhile, I Know First predictive algorithm provided daily forecasts for these assets and the following sections are going to present the results of these forecasts in terms of hit ratio on different time horizons. The below charts illustrate the volatility experienced by the analyzed indexes and ETFs over the last year:


Evaluating the Stock Market Forecast Hit Ratio

We must keep in mind that the performance evaluation period covers the COVID-19 times from the beggining of November 2020 until nowadays. The market is still unprecedentedly volatile. Even though the difficulty of an accurate prediction increased a lot, the algorithm is still able to consistently predict the above-mentioned US market indexes throughout various time horizons. The hit ratio reached by the algorithm was 100% for a 1-year time horizon for ETF SPY, Dow Jones Industrial and Transportation Indexes. Moreover, our team recorded great performance results on a 3-months horizon across all the considered assets except the Russell 2000. The general trend that we discovered over this time is that the longer the time horizon was, the more efficient and reliable the algorithm’s predictions were due to enormous short-term volatility amplitudes. Therefore, this allows our investors to have a safer outlook when investing despite these volatile time periods.
Conclusion
This evaluation report presented the performance of I Know First’s algorithm showing the hit ratio for 6 time horizons. We have achieved great results for all analyzed indexes and ETFs under the current COVID-19 situation. Moreover, we confirmed the predictive abilities of our proprietary AI algorithm to predict direction for smaller capitalization companies cluster and the transportation industry which is extremely important for investors to navigate through times of US economic recovery. This indicates that our forecasts were able to indicate the future movement of these indexes correctly across all time horizons. I Know First’s research team will continue to monitor the algorithm’s performance and derive relevant insights that will help provide the best algorithmic trading solutions to our clients.


