I Know First Algorithm Performance Analysis (Part 2)
 Co-Founder & CTO of I Know First Ltd. With over 35 years of research in AI and machine learning. Dr. Roitman earned a Ph.D from the Weizmann Institute of Science
Trading Strategies Analysis
Date : 10/02/2014 (m.d.y)
In the previous Part 1 article we analyzed the Top-10 data set, and compared it to a large, non-selected pool of signals. We proved that the Top-10 strategy, which is selecting stocks on the basis of high predictability and high signal strength, is superior to the non-Top-10. We are now conducting a number of additional simulations, were we quantify the signal strength, predictability, and trends, with more statistical details. The purpose is to find a “sweet spot”, the one rule that works for most of the markets most of the time, and shows less variation between different equities.
This report confirms the findings of the Part 1 report, and also gives more detailed statistics. It confirms the importance of the signal strength and the rule of “trading when the signal is with the trend”, when the signal is weaker.
In this Part 2 we use the large data set as a whole, and also break it down in groups:
- Stock Indexes
- Index funds
- Stocks (the largest group)
- Currencies
- Commodities
- Interest rates
- Precious Metals
The “signal” used in Part 1 is the sum of up to three signals from 30 days to a year, if they appear in the top-10 table. For instance, if the stock does not appear in the 90 days forecast top ten table of that day, then it was not counted. If three of the five last days have a positive signal, then the final majority signal is positive.Unlike in Part 1, in this study we examine five signals regardless of the top 10 status (regardless of signal strength). The “signal” here is an arithmetic sum (including signal strength) of five time range signals from 7 days to a year. While in Part 1 the price trigger was a difference between the recent price and the price 5 days ago, here the difference between the recent price and an average of five or seven days was used as a trigger.
Simulated Trading Results
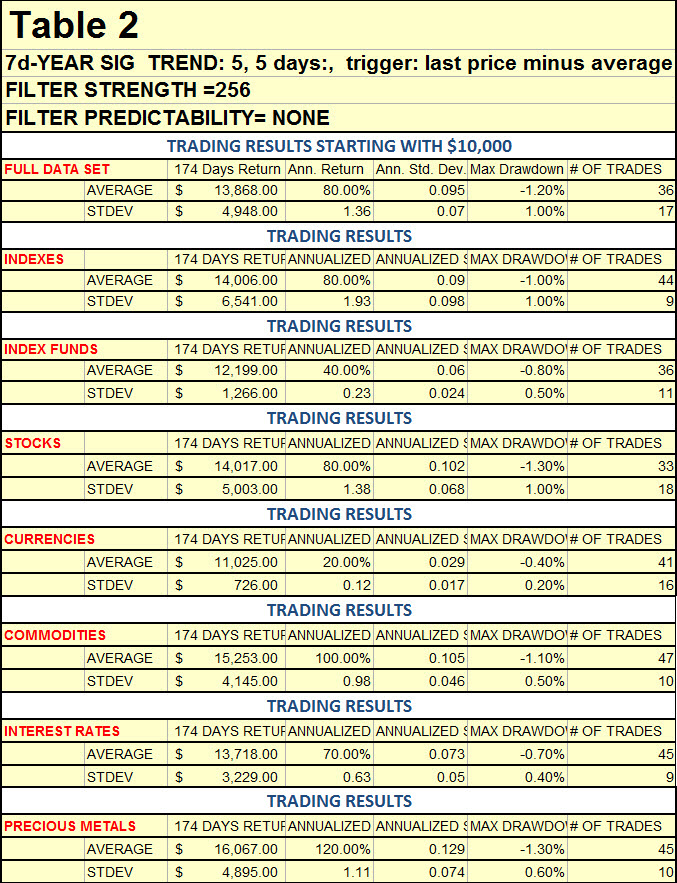
Tables 1, 2 and 3 give the three best results which show the simulated trading of the last 174 days, starting with $10,000 capital. Trading costs were ignored. The overnight price gaps were ignored: trade assumed at the open of the day of forecast at the last price known before the forecast. The table shows the average return after 174 days, the annualized return, the annualized standard deviation of returns, the maximum drawdown, and the number of trades per equity. All the numbers are averages of many transactions with different equities.
The rules for entry (buy):
- Last close of the specific market is above the 5 days average.
- Average of the last 5 days forecast signals is “up”.
- If both rules are true, then buy.
The rules for selling short:
- Last close is lower than the 5 days average.
- Average of the last 5 days forecasts is “down
- If both rules are true, then sell.
Exit conditions:
- If either of the two entry rules is broken, then exit.
Discussion
The three tables above are the best results of many simulations, were the trade with or against the trend, and percent difference between the last price and the past average was varied. These results (about 80 gigabytes worth) are still being analyzed.
In the majority of cases trading with the trend (signal and trend in the same direction) proved superior to going against the trend.
The 5 days average signal/trend combination was a better trigger than the 7 days.
The best trades were when the difference between the last close and the average was under 1%. If the difference was between 1 and 6% in either direction, when either buying or selling, the results were less than optimal, but still positive.
Interpretation: if the last price deviates too much from the average, chances are the trend is broken. This research is still in progress as to how to trade when the trend is broken.
The rules for entry and exit
The rules for entry (buy):
- Last close of the specific market is above the 5 days average, (best within 1%).
- Average of the last 5 days forecast signals is “up”. The signal is best to be between 128 and 256 (smaller or higher are ok too).
- If both rules are true, then buy.
The rules for selling short:
- Last close is lower than the 5 days average, (best within 1%).
- Average of the last 5 days forecasts is “down”. absolute value of the signal is best to be between 128 and 256.
- If both rules are true, then sell.
Exit conditions:
- If either of the two entry rules is broken, then exit.
Finally, most regular stocks traders do not sell short. Instead, they go into cash and wait for an opportunity to re-enter. Thus their trading strategy is “long”- biased. We are studying that strategy as well.


